
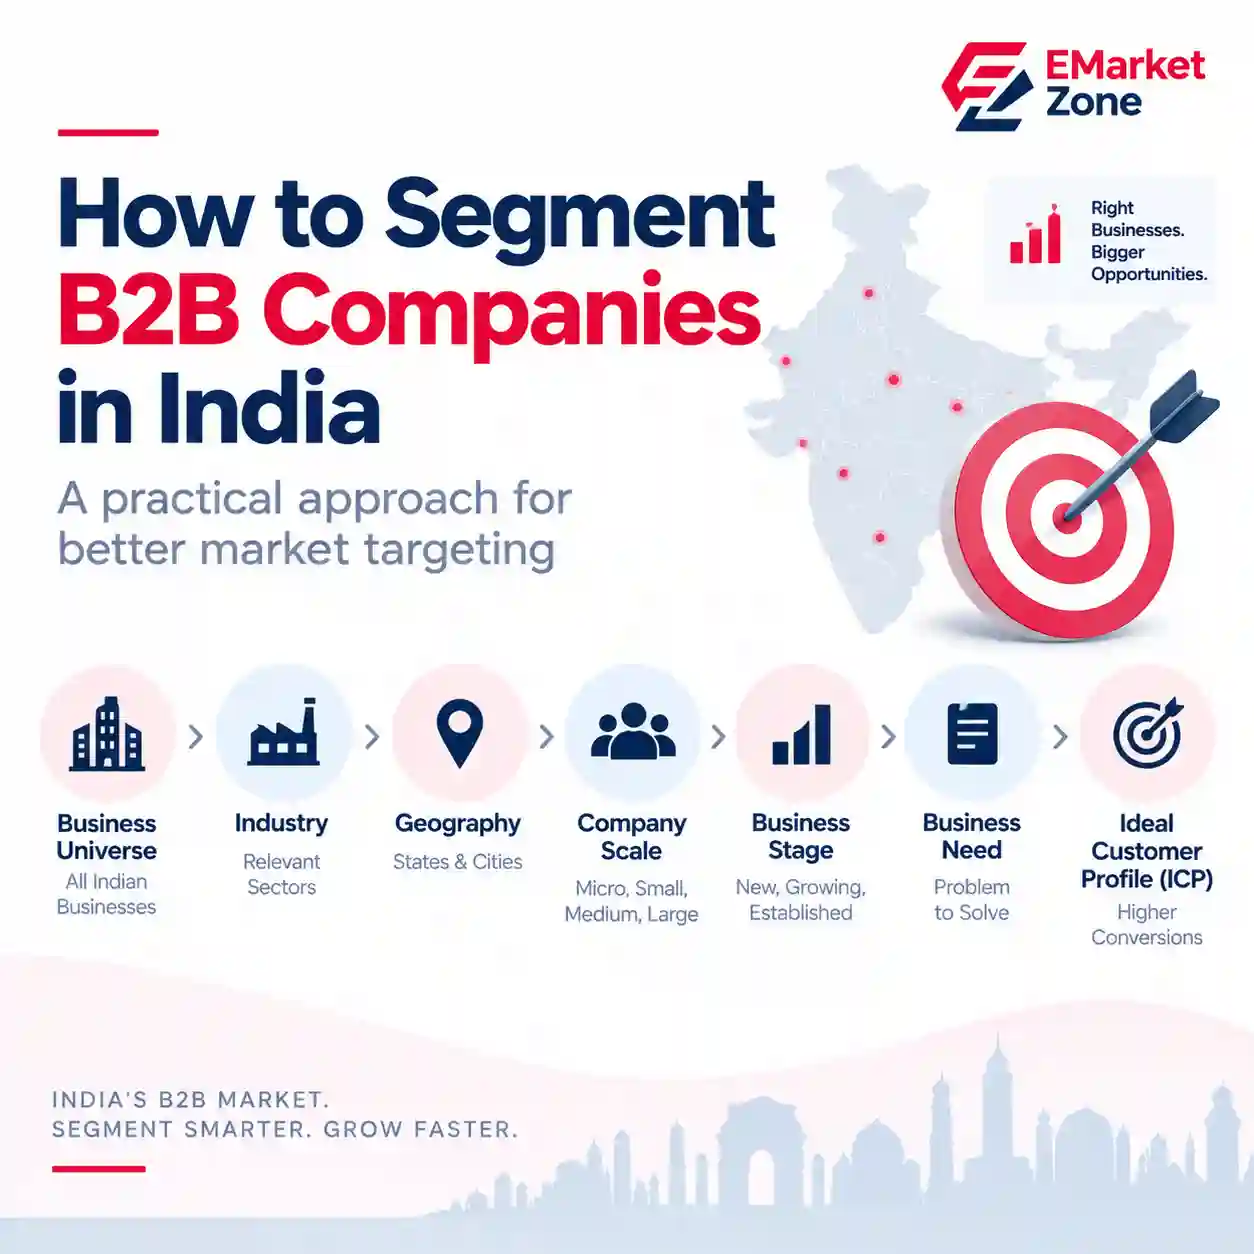
India’s B2B market is too large to approach as one audience. A company selling software, industrial equipment, financial services or logistics solutions may have millions of potential businesses in the country, but only a fraction will have the right combination of industry, geography, size and business need.
So how should a business segment the Indian B2B market?
The answer is not to create hundreds of narrow categories. A practical segmentation model uses a small number of layers and progressively narrows the market.
➡️ India Business Landscape Report 2026
For a comprehensive overview of India’s business ecosystem, explore our India Business Landscape Report 2026.
What Is B2B Market Segmentation?
B2B segmentation means dividing a broad business market into groups that share commercially relevant characteristics.
The most useful segmentation variables are usually:
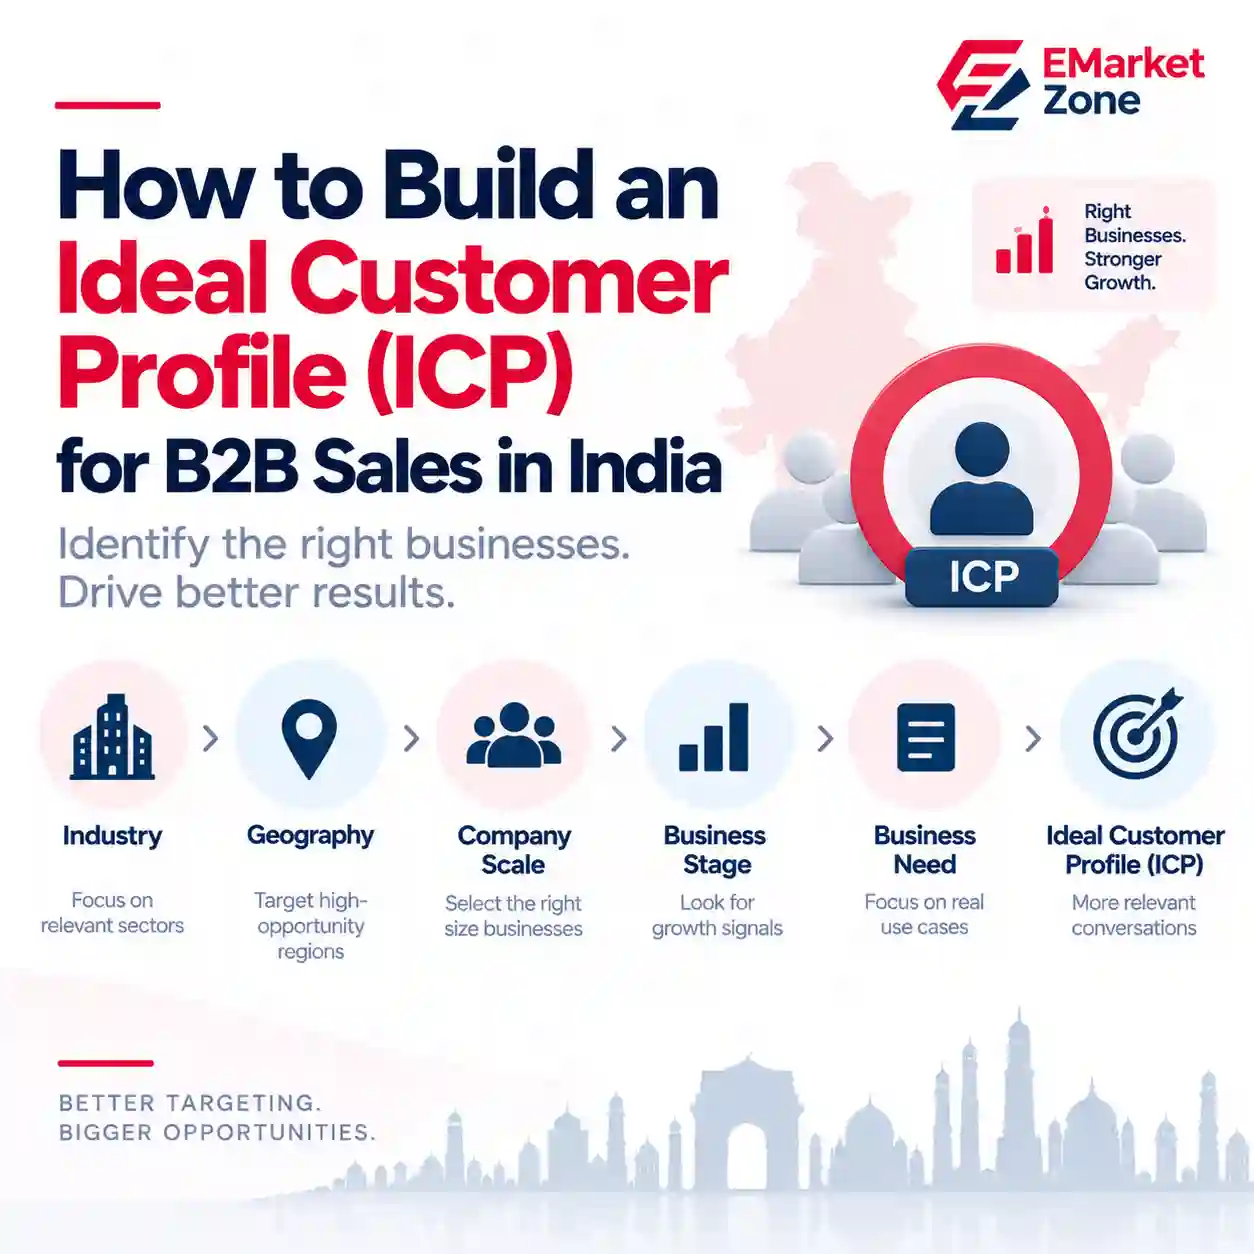
Business Type → Industry → Geography → Company Scale → Business Stage → Business Need
This approach is more useful than segmentation based only on company name, registration type or location.
For example, “manufacturing companies in India” is still a very broad market. “Small and mid-sized automotive component manufacturers in Pune and Chennai” is much more actionable for a supplier serving that industry.
Which Segmentation Layers Should a B2B Company Use?
1. Business Type
Start by identifying what kind of organization you are targeting.
Examples include:
• Manufacturers
• Distributors
• Wholesalers
• Retailers
• Service providers
• Technology companies
• Exporters
• Importers
The appropriate category depends on the product being sold.
A machinery supplier may need manufacturers, while a distribution-management platform may need wholesalers and distributors.
2. Industry
Industry is often the most important layer because it determines whether the customer’s problem actually exists.
Instead of targeting “all businesses”, a company could focus on:
• Automotive
• Pharmaceuticals
• Chemicals
• Textiles
• Electronics
• Healthcare
• Logistics
• Technology
• Construction
• Financial services
The Ministry of MSME’s current dashboard separately tracks registered enterprises by broad activities including manufacturing, services and trading, demonstrating why business activity is an important first-level distinction.
The key question is:
Which industries have the strongest natural need for what we sell?
3. Geography
The same industry can behave very differently across Indian markets.
A business can segment by:
Country → State → City → Industrial Cluster
For example, a manufacturing-focused company may identify particular states and cities where its target industry is concentrated rather than approaching businesses nationally.
The MSME Ministry’s state-wise dashboard provides registration data at state level and distinguishes micro, small and medium enterprises, making geography a useful first-stage market filter.
For a deeper analysis of India’s geographic B2B opportunity, see the India B2B Market Opportunity Report 2026.
4. Company Scale
Company size changes the economics of selling.
India’s MSME classification was revised from 1 April 2025. Under the revised framework, a micro enterprise can have investment up to ₹2.5 crore and turnover up to ₹10 crore; small enterprises up to ₹25 crore investment and ₹100 crore turnover; and medium enterprises up to ₹125 crore investment and ₹500 crore turnover.
This creates useful segmentation possibilities such as:
Micro → Small → Medium → Larger Companies
However, size should not be treated as a proxy for value.
A smaller company can have an urgent requirement and high customer fit, while a large company may have a long procurement process or little immediate need.
5. Business Stage
Company stage adds another dimension.
Two companies with similar revenue and industry profiles may have completely different requirements if one is established and the other is rapidly expanding.
Useful signals can include:
• New business formation
• Expansion
• New facilities
• Hiring
• Product launches
• Export activity
• Fundraising
• Geographic expansion
These signals can help distinguish a static target list from a market containing businesses with potentially active requirements.
6. Business Need
The final layer is often the most commercially meaningful.
Ask:
What problem are we solving for this company?
A company may fit the industry and geography perfectly but still have no current requirement for your product.
For example:
Industry: Manufacturing
Geography: Maharashtra
Company Scale: Mid-market
Business Stage: Expansion
Need: Production automation
That profile is considerably more actionable than simply searching for “manufacturing companies in Maharashtra.”
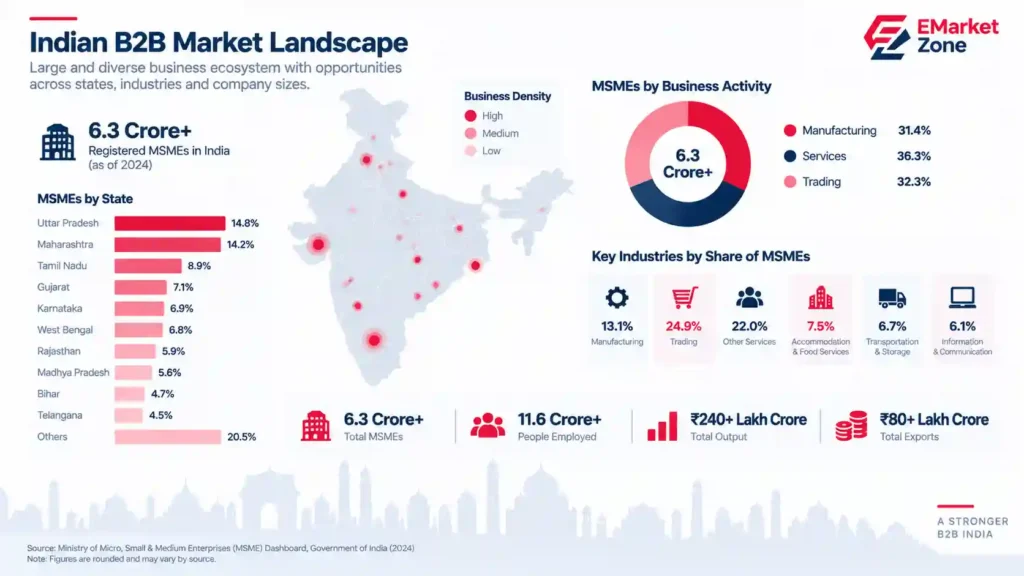
How Do These Layers Work Together?
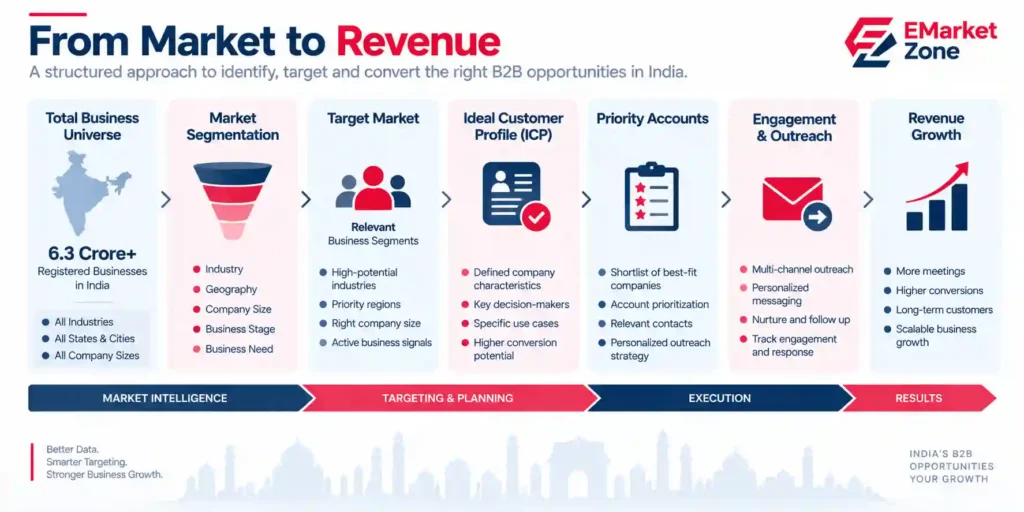
A practical B2B segmentation model can look like this:
Business Universe
↓
Industry
↓
Geography
↓
Company Scale
↓
Business Stage
↓
Business Need
↓
Ideal Customer Profile
↓
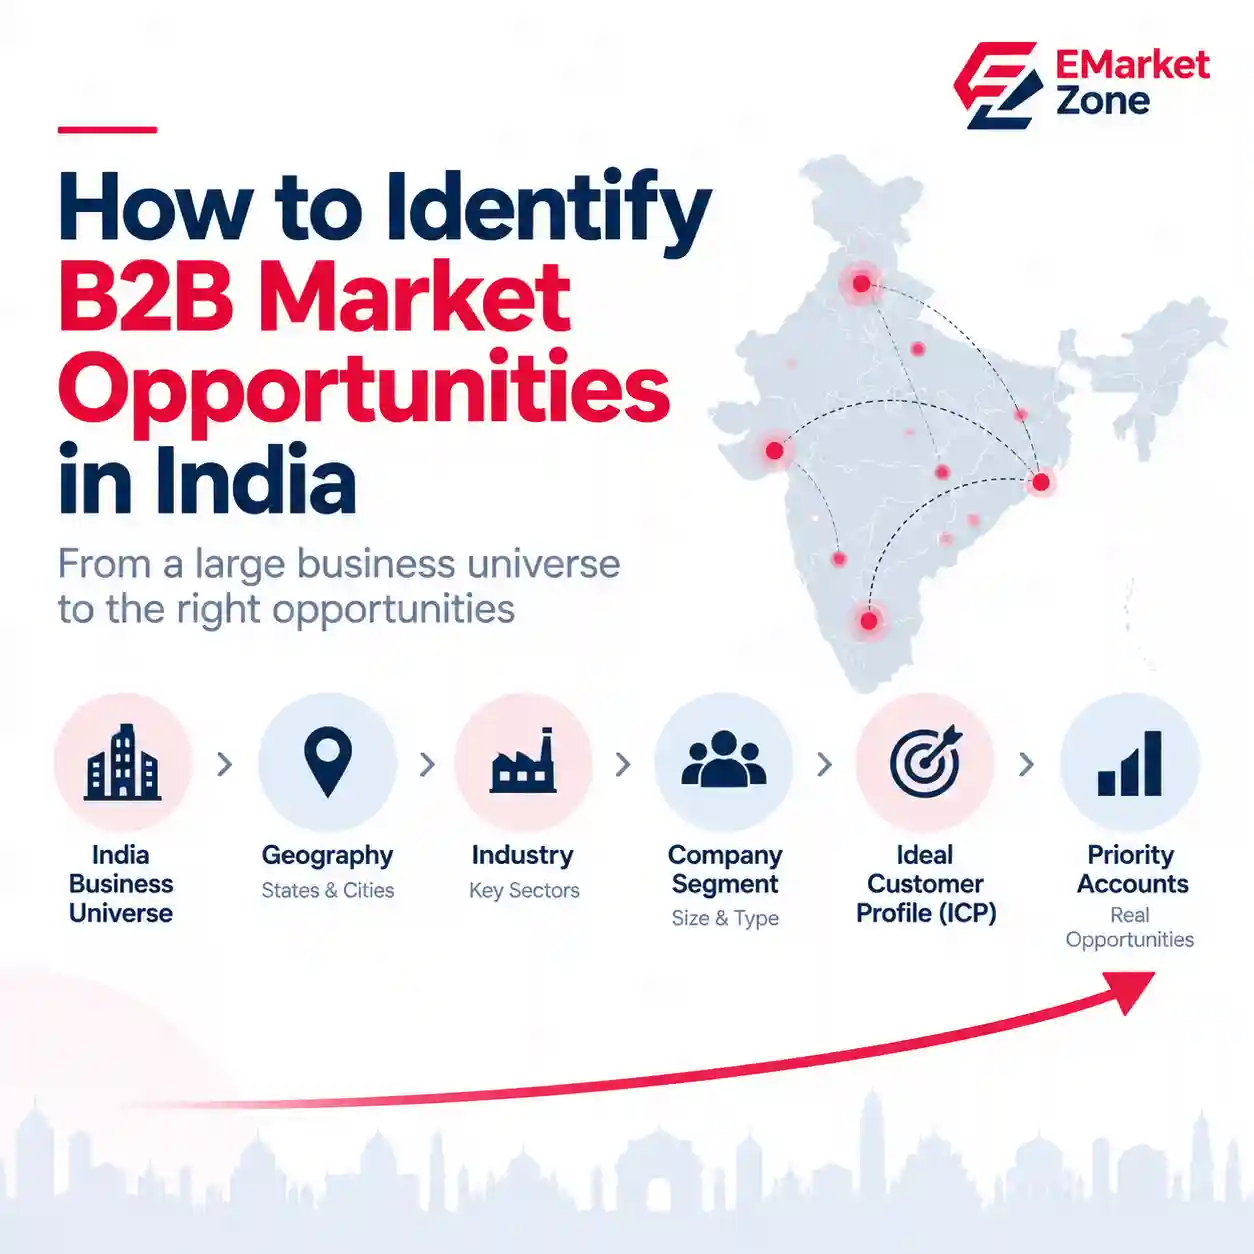
Priority Accounts
The objective is not to keep narrowing the market indefinitely.
The objective is to reach a segment that is large enough to support growth but specific enough to produce meaningful targeting.
What Is the Difference Between Segmentation and Targeting?
This distinction matters.
Segmentation divides the market into meaningful groups.
Targeting determines which of those groups the company will actively pursue.
For example:
Manufacturing companies → Automotive manufacturers → Maharashtra → Mid-market → Expanding companies
is segmentation.
Deciding to allocate the sales team’s next quarter specifically to that group is targeting.
The two processes should not be confused.
For national-level statistics, explore India Business Statistics 2026.
Why More Data Does Not Automatically Mean Better Targeting
A database can contain thousands or millions of records and still be commercially weak if the records are poorly classified or lack useful context.
Useful B2B intelligence should ideally connect:
Company
• Industry
• Location
• Scale
• Business Signals
• Decision-Maker
This is what turns a large business universe into a usable target market.
The broader research behind this framework is covered in the India B2B Market Opportunity Report 2026.
Frequently Asked Questions
What is the best way to segment B2B companies in India?
Start with business type, industry and geography, then add company scale, business stage and business need. The exact combination should depend on the product and sales model.
Should B2B companies segment by industry or geography first?
There is no universal order. If the product is highly industry-specific, industry may be the stronger first filter. If the business operates through local sales teams or distribution networks, geography may be more important.
Is company size enough for B2B targeting?
No. Company size provides useful context, but industry, location, business need and timing can be equally important.
What is an ICP in B2B?
An Ideal Customer Profile (ICP) describes the characteristics of companies that are most relevant to a particular product or service.
How can segmentation improve B2B lead generation?
It can reduce irrelevant prospecting by helping sales and marketing teams focus resources on companies that better match the intended customer profile.
Related Research
For the broader analysis of India’s business ecosystem, see the India Business Landscape Report 2026.
For state-level business comparisons, see Top Business States in India 2026.
For national-level statistics, explore India Business Statistics 2026.
For detailed MSME data, see State-wise MSME Statistics in India 2026
For city-level business comparisons, see Top Business City in India 2026.
References
Ministry of Micro, Small & Medium Enterprises, Government of India – MSME Performance Dashboard
Ministry of MSME – Annual Report 2025–26
Ministry of Corporate Affairs – Company Statistics
Leave a comment