
India Business Statistics 2026: Key Numbers, Trends & Data
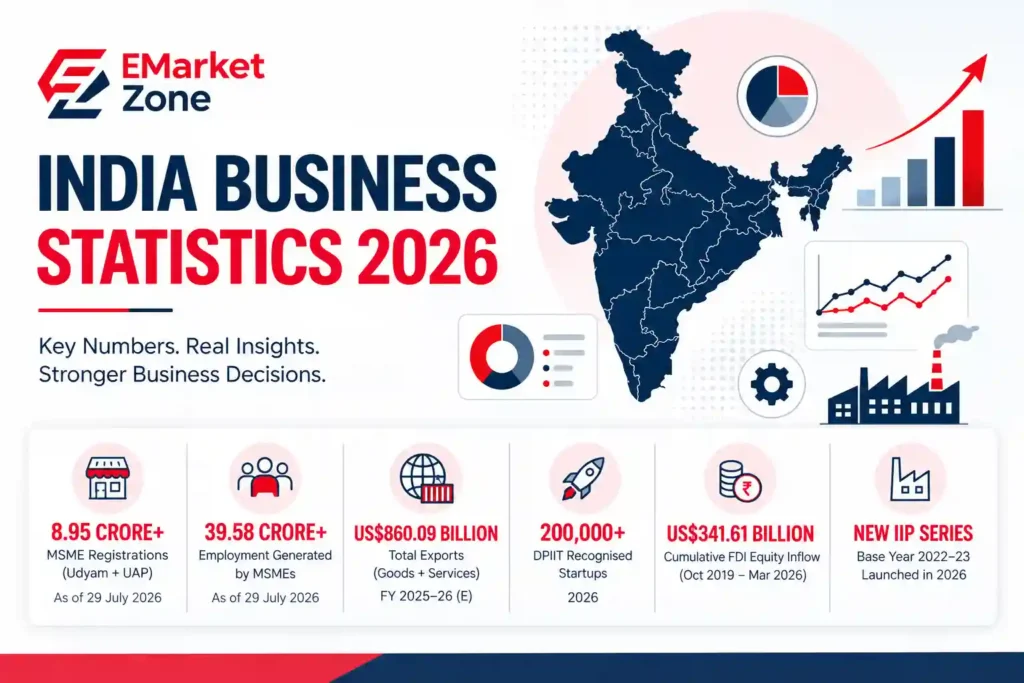
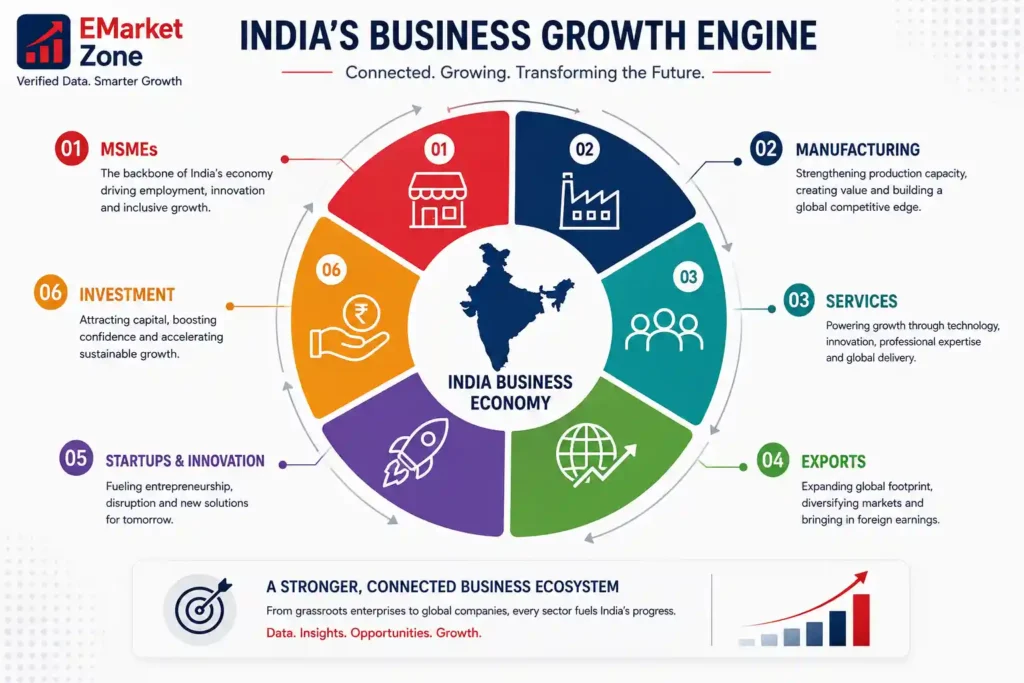
India’s business economy is expanding across multiple dimensions, from the formalization of small enterprises and growth in exports to startup creation, digital adoption, investment and manufacturing.
No single statistic captures the size or direction of India’s business ecosystem. A more useful view combines indicators covering economic growth, MSMEs, employment, exports, foreign investment, startups and industrial activity.
This page brings together key national-level indicators from government and institutional sources to provide a concise reference point for understanding India’s business environment in 2026.
Data note: Different indicators are reported on different dates and frequencies. The reporting period is therefore shown alongside each statistic rather than treating all figures as if they represented the same date.
For a broader analysis of India’s business ecosystem, regional development, industries and future growth, read the India Business Landscape Report 2026.
India Business Statistics at a Glance
| Indicator | Latest Available Figure | Reference |
|---|---|---|
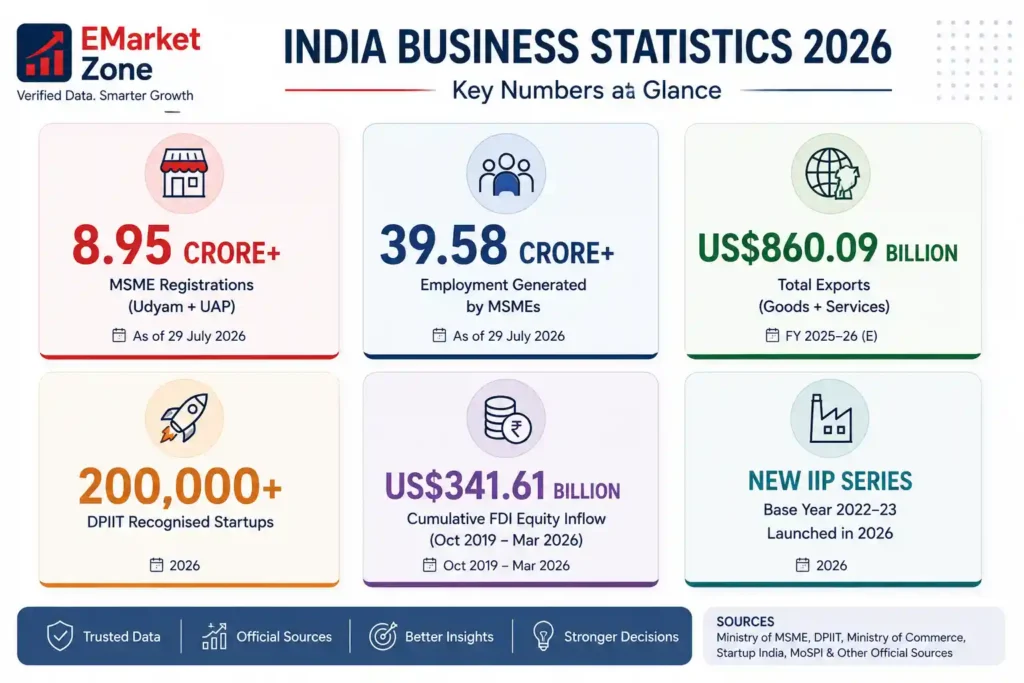
| MSME registrations including UAP | 8.95 crore | 29 July 2026 |
| Udyam registrations | 5.08 crore | 29 July 2026 |
| Udyam Assist Platform registrations | 3.86 crore | 29 July 2026 |
| MSME employment generated | 39.58 crore | 29 July 2026 |
| Total exports — goods + services | US$860.09 billion | FY 2025–26 |
| Merchandise exports | US$441.78 billion | FY 2025–26 |
| Services exports | US$418.31 billion | FY 2025–26 |
| DPIIT-recognised startups | 200,000+ | 2026 |
| Cumulative FDI equity inflow | US$341.61 billion | Oct. 2019–Mar. 2026 |
The MSME figures come from the Ministry of MSME dashboard; exports are based on FY2025–26 estimates reported from government data; Startup India reported more than 200,000 DPIIT-recognised startups in its National Startup Day 2026 material; and the FDI figure comes from DPIIT’s state-wise FDI data.
1. MSME Ecosystem
MSMEs remain one of the largest components of India’s formalizing business ecosystem.
As of 29 July 2026, the Ministry of MSME dashboard recorded 89.46 million registrations including Udyam and the Udyam Assist Platform. This comprised approximately 50.84 million Udyam registrations and 38.63 million UAP registrations.
MSME STRUCTURE
| Category | Registrations |
|---|---|
| Micro | 88,879,788 |
| Small | 539,573 |
| Medium | 41,641 |
| Total | 89,461,002 |
The same dashboard reports approximately 39.58 crore employment opportunities associated with the registered MSME ecosystem.
MSME ACTIVITY MIX
| Activity | Registrations |
|---|---|
| Trading | 3,77,80,914 |
| Services | 3,36,68,421 |
| Manufacturing | 1,80,11,288 |
This distribution shows that India’s formal MSME ecosystem extends well beyond manufacturing, with trading and services representing substantial shares of registered activity.
Checkout the MSME Database India for lead generation and outreach
2. India's Export Economy
India’s external trade remains an important component of its growth model, with services playing an increasingly significant role alongside merchandise exports.
For FY2025–26, India’s combined merchandise and services exports were estimated at US$860.09 billion, compared with US$825.26 billion in FY2024–25, representing growth of approximately 4.22%.
| Export Category | FY2025–26 |
|---|---|
| Merchandise exports | US$441.78 billion |
| Services exports | US$418.31 billion |
| Total exports | US$860.09 billion |
Services exports increased from approximately US$387.55 billion to US$418.31 billion, making services a major contributor to the overall increase in India’s exports.
Key Insight
India’s export economy is increasingly diversified between manufactured goods and globally traded services. This creates opportunities not only for large exporters but also for technology companies, professional services firms, manufacturers and specialized suppliers.
Checkout the Company Database India for lead generation and outreach
3. Startup Ecosystem
India’s startup ecosystem has expanded substantially since the launch of Startup India in 2016.
Startup India’s National Startup Day 2026 material reports 200,000+ DPIIT-recognised startups, along with more than ₹27,000 crore in funding through the Startup India Initiative. It also reports that 53% of recognised startups are located in Tier-2 and Tier-3 cities, demonstrating that startup activity is spreading beyond the largest metropolitan centres.
Startup India – Selected Indicators
| Indicator | Latest Reported Figure |
|---|---|
| DPIIT-recognised startups | 200,000+ |
| Tier-2 & Tier-3 startup share | 53% |
| Startup India funding | ₹27,000+ crore |
| Seed-funded incubators | 244 |
| States/UTs with startup policy | 32 |
| Recognised startups with at least one woman director | 48% |
This geographic expansion matters because it broadens India’s potential business and investment markets beyond traditional technology centres.
These national statistics provide the broader context for our detailed analysis of the Top Business States in India.
4. Foreign Direct Investment
Foreign investment provides another view of India’s business attractiveness.
DPIIT’s latest state-wise data records cumulative equity FDI inflows of approximately US$341.61 billion between October 2019 and March 2026.
The distribution is highly concentrated among major investment destinations, with Maharashtra, Karnataka and Gujarat occupying the leading positions in the state-level data.
This reinforces an important point from the previous statistics page:
Business scale and investment strength are related, but they are not identical.
A state may have a very large MSME ecosystem without being one of the largest FDI destinations, while another may attract substantial international investment because of its technology, manufacturing, financial or infrastructure ecosystem.
For the detailed state-level comparison, see Top Business States in India 2026 : State-wise MSME & FDI Statistics.
5. Economic Growth
India’s broader economic performance provides the context for these business indicators.
The Economic Survey 2025–26 describes the Indian economy through chapters covering the state of the economy, services, industry, investment and infrastructure, employment and skill development, AI, urbanisation and the external sector.
The Survey’s earlier first-advance-estimate discussion had projected FY2025–26 real GDP growth in a range of 6.3–6.8%, while subsequent official national-accounts releases have updated the FY2025–26 estimates. MoSPI released the Provisional Estimates of GDP for FY2025–26 and Q4 FY2025–26 on 5 June 2026.
6. Manufacturing and Industrial Activity
Manufacturing remains a major component of India’s economic transformation, particularly as the country seeks to expand domestic production, integrate into global supply chains and increase higher-value exports.
MoSPI’s statistical framework tracks industrial activity through the Index of Industrial Production (IIP), including separate indicators for manufacturing, mining and quarrying, electricity, gas and water-related activities.
The Government also introduced a new IIP series with base year 2022–23 in 2026, providing an updated framework for measuring industrial production.
Why this matters
Manufacturing growth has implications beyond factories themselves. It creates demand across:
- Engineering
- Machinery
- Logistics
- Packaging
- Industrial services
- Chemicals
- Electronics
- Components
- Business-to-business suppliers
This makes industrial expansion an important driver of the wider B2B economy.
Checkout the Manufacturer Database India for lead generation and outreach
7. India's Business Activity Is Becoming More Formal and Digital
The growth of Udyam registrations, digital government infrastructure, startup recognition and digitally enabled business services reflects a broader formalization of India’s business ecosystem.
The Ministry of MSME’s 2025–26 Annual Report highlights the use of integrated digital systems and the Performance Smartboard for data-driven monitoring and planning.
This shift has practical consequences for businesses.
More structured business information makes it easier to:
- Identify companies
- Segment markets
- Analyze industries
- Find regional opportunities
- Build targeted prospect lists
- Track business ecosystems
- Develop data-driven expansion strategies
Key Business Trends - 2026
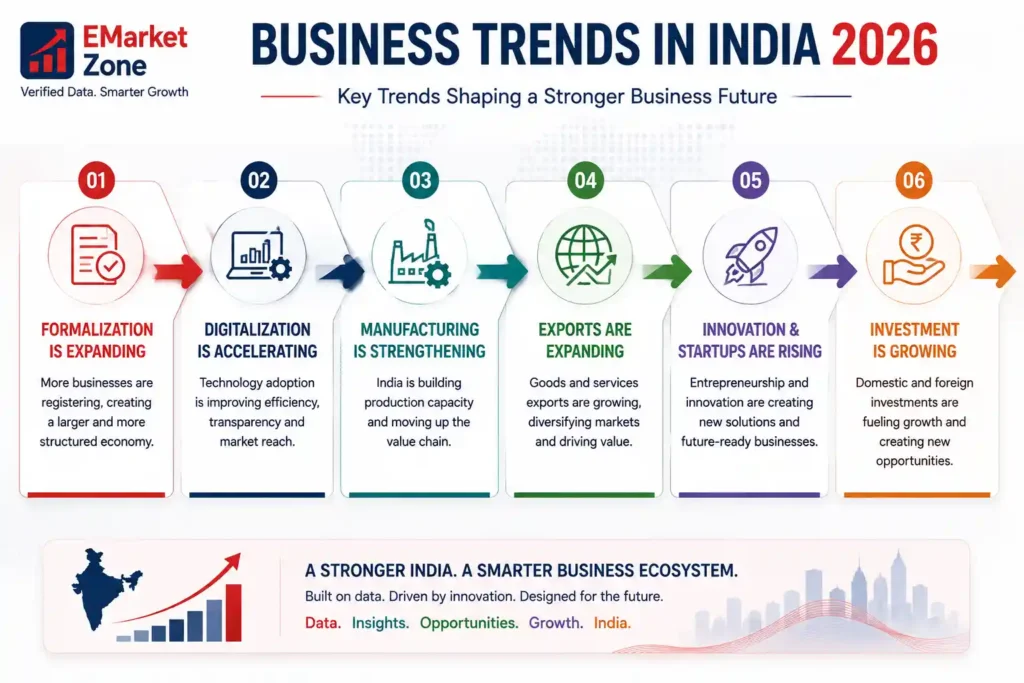
The combined statistics point toward six major trends:
1. Formalization is expanding
The registered MSME ecosystem has reached a very large scale, supported by Udyam and Udyam Assist registrations.
2. Services remain a major growth engine
Services account for a substantial portion of India’s export economy and remain central to technology, professional services and global business activity.
3. Manufacturing is becoming strategically important
Industrial policy and the new IIP statistical framework reflect India’s continued focus on manufacturing and production capacity.
4. Startup activity is spreading geographically
More than half of recognised startups are reported to be located in Tier-2 and Tier-3 cities, showing that entrepreneurship is moving beyond the largest metros.
5. Investment remains concentrated
FDI continues to be concentrated in major economic and industrial centres, particularly Maharashtra, Karnataka and Gujarat.
6. Data is becoming more important to business decisions
As India’s business ecosystem becomes larger and more geographically distributed, businesses increasingly need structured data to identify markets, companies and growth opportunities.
India Business Statistics: Quick Reference
| Area | Key Indicator |
|---|---|
| MSMEs | 8.95 crore including UAP |
| MSME Employment | 39.58 crore |
| MSME Activity | Trading, services and manufacturing |
| Exports | US$860.09 billion in FY2025–26 |
| Services Exports | US$418.31 billion |
| Recognised Startups | 200,000+ |
| FDI | US$341.61 billion cumulative, Oct 2019–Mar 2026 |
| Industrial Measurement | IIP with new 2022–23 base |
| Startup Geography | 53% in Tier-2/3 cities |
What These Numbers Mean for Businesses
The most important conclusion is not any individual number.
It is the interaction between them.
India has a large and increasingly formalized MSME ecosystem, a substantial export economy, a rapidly expanding startup base, significant foreign investment and continued industrial development. Together, these create a broad and increasingly complex B2B market.
For businesses looking for customers, suppliers, partners or expansion opportunities, the challenge is therefore shifting from finding businesses to finding the right businesses.
That requires segmentation by:
- State
- City
- Industry
- Company type
- Business size
- Activity
- Target market
This is where structured business intelligence becomes commercially useful.
Related Data & Research
Read the full research report:
India Business Landscape Report 2026
Explore the state-level analysis:
Top Business States in India 2026
Explore state-level statistics:
State-wise MSME & FDI Statistics
Sources
- Ministry of MSME — MSME Performance Smartboard
- Ministry of MSME — Annual Report 2025–26
- DPIIT — State-wise FDI Equity Inflow Data
- Ministry of Commerce / Government of India — Export data
- Startup India — National Startup Day 2026
- Ministry of Statistics & Programme Implementation — National Accounts and IIP statistics
- Economic Survey 2025–26
- EMarket Zone Research & Analysis team