
Industry-wise B2B Business Statistics In India 2026
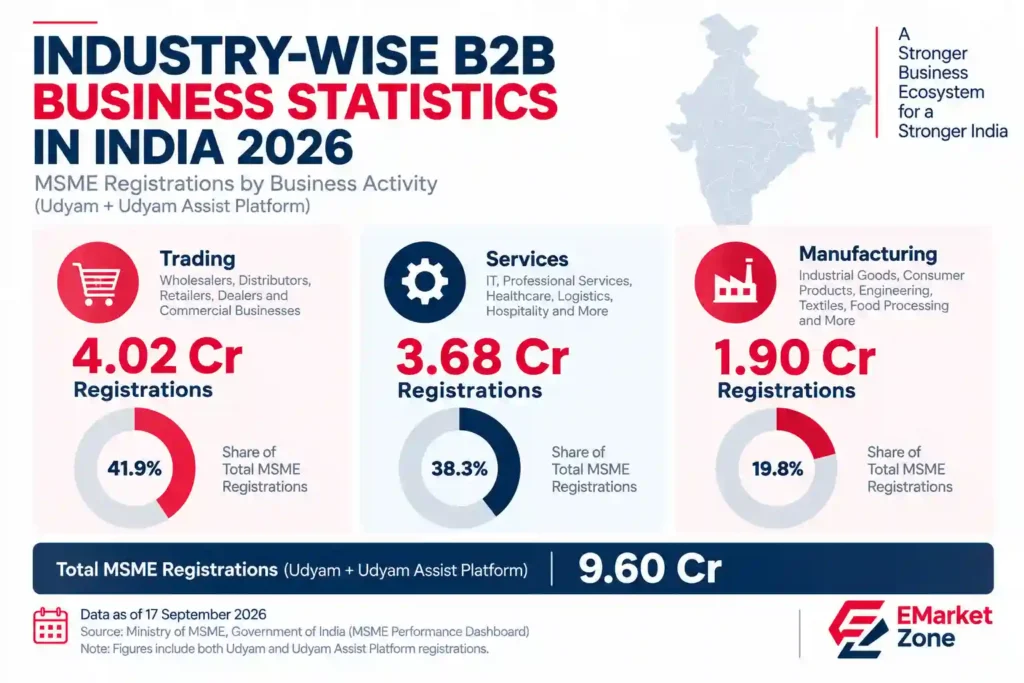
India’s B2B ecosystem spans a wide range of economic activities, but the latest MSME registration data shows a clear structural pattern: trading and services account for the majority of registered activity, while manufacturing represents a substantial industrial base.
According to the Ministry of MSME’s Performance Dashboard, India had 9.60 crore Udyam and Udyam Assist Platform registrations as of 17 September 2026. Of these, 4.02 crore were trading, 3.68 crore were services and 1.90 crore were manufacturing registrations.
India's MSME Activity Structure
| Activity | Registrations | Approx. Share |
|---|---|---|
| Trading | 4.02 crore | 41.9% |
| Services | 3.68 crore | 38.3% |
| Manufacturing | 1.90 crore | 19.8% |
| Total | 9.60 crore | 100% |
Source: Ministry of MSME Performance Dashboard; figures as of 17 September 2026. Shares calculated from reported registration totals.
Trading Forms the Largest Activity Group
Trading represents approximately 4.02 crore registrations, making it the largest of the three broad activity categories.
Trading businesses form important B2B networks through wholesalers, distributors, retailers, dealers and commercial intermediaries. This creates potential demand for logistics, financial services, software, marketing, procurement and other business services.
Services Represent a Major B2B Market
Services account for approximately 3.68 crore registrations, or about 38.3% of the total.
The service ecosystem covers a wide range of businesses, meaning the commercial characteristics of one service segment can differ significantly from another. Technology, professional services, healthcare, logistics and other service businesses can have very different customer profiles and purchasing requirements.
Manufacturing Creates Deep Supply-Chain Opportunities
Manufacturing accounts for approximately 1.90 crore registrations, representing about 19.8% of the total.
Although smaller than trading and services by registration volume, manufacturing can generate extensive B2B relationships across suppliers, distributors, machinery providers, logistics companies, technology vendors and other supporting businesses.
The Ministry’s latest annual report also notes that trading and services constitute a larger proportion of Udyam registrations than manufacturing.
Why Activity Data Matters for B2B
These figures show the scale and structure of India’s business ecosystem, but they do not determine which sector is commercially best for a particular company.
A B2B opportunity becomes more specific when activity is combined with:
Industry → Geography → Company Type → Company Scale → Business Stage → Business Need
For example, a manufacturer selling industrial equipment may need to identify manufacturing clusters rather than target the entire MSME universe. A SaaS company may instead focus on specific service or trading segments in selected cities.
That is why activity statistics are best viewed as a starting point for market segmentation, not as a standalone measure of opportunity.
Explore the Full B2B Market Analysis
These statistics provide only one layer of India’s B2B landscape. Our India B2B Market Opportunity Report 2026 examines how geography, industries, company structure, scale, business stage and market intelligence can be combined to identify more relevant B2B opportunities.
For the broader national business landscape, see the India Business Landscape Report 2026.
Sources
Ministry of Micro, Small & Medium Enterprises, Government of India – MSME Performance Dashboard. Data as of 17 September 2026.