
About This Report
This report examines the landscape of new GST registrations in India, with a focus on registration trends, geographic distribution, industry patterns, and the emergence of new business activity. The analysis covers India at the national, state, and industry levels, using available data for the selected research period through October 2026.
GST registration activity provides a useful indicator of businesses entering or formalising within India’s tax and regulatory framework. While registrations should not be interpreted as a direct measure of active businesses, revenue, or commercial success, they can provide valuable insight into where formal business activity is emerging and which markets warrant closer attention.
The research is intended for B2B companies, sales and marketing teams, market researchers, investors, consultants, and business-data users seeking to understand emerging commercial markets and identify potential areas for targeted business development.
Prepared by EMarket Zone
Business Data • Market Intelligence • B2B Lead Generation
Executive Summary
1.1 India at a Glance
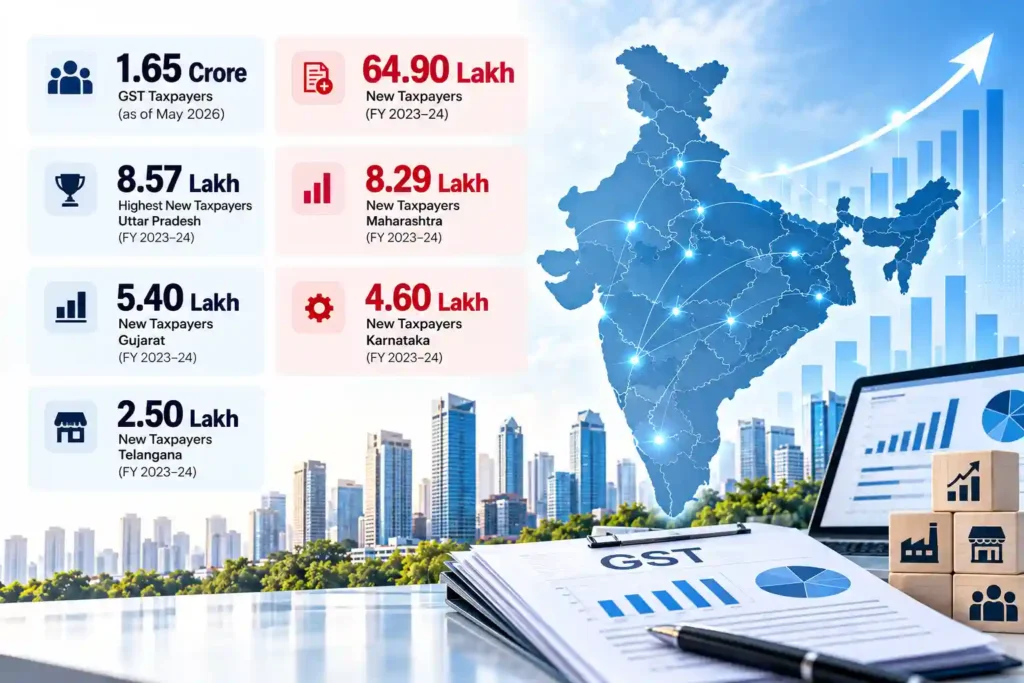
India’s GST ecosystem has continued to expand significantly since the introduction of GST in 2017. The number of GST taxpayers increased from 66.5 lakh in 2017 to 1.65 crore by May 2026, reflecting the continued expansion of the formal tax base. Press Information Bureau
The latest GSTN state-wise dataset that provides a comparable measure of new taxpayers records 64.90 lakh new taxpayers across India in FY 2023–24. These figures provide a stronger basis for analysing business formation than simply looking at the total GST taxpayer base. GST Tutorial
Key indicators
1.65 crore
GST taxpayers as of May 2026 Press Information Bureau
64.90 lakh
New taxpayers recorded in FY 2023–24 GST Tutorial
8.57 lakh
New taxpayers in Uttar Pradesh in FY 2023–24—the highest among states GST Tutorial
8.29 lakh
New taxpayers in Maharashtra in FY 2023–24 GST Tutorial
5.40 lakh
New taxpayers in Gujarat in FY 2023–24 GST Tutorial
4.60 lakh
New taxpayers in Karnataka in FY 2023–24 GST Tutorial
2.50 lakh
New taxpayers in Telangana in FY 2023–24 GST Tutorial
What the numbers show
The distribution of new GST taxpayers is highly concentrated among India’s major commercial states. Uttar Pradesh, Maharashtra, Gujarat, Tamil Nadu and Karnataka together accounted for a substantial share of the 64.90 lakh new taxpayers recorded nationally in FY 2023–24. GST Tutorial
This concentration matters for businesses because national-level market opportunity does not translate evenly across every geography. The location of newly registered taxpayers can help identify markets where the formal business base is expanding and where B2B companies may find a larger pool of potential accounts.
Source: GSTN, 7 Years of GST Report.
| State | New taxpayers |
|---|---|
| Uttar Pradesh | 857,609 |
| Maharashtra | 828,677 |
| Gujarat | 539,568 |
| Tamil Nadu | 531,361 |
| Karnataka | 459,748 |
| Rajasthan | 344,350 |
| West Bengal | 313,386 |
| Telangana | 249,852 |
| Bihar | 249,437 |
| Haryana | 249,313 |
1.2 Key Findings
Finding 1 – India’s formal GST taxpayer base continues to expand
The GST taxpayer base has increased from 66.5 lakh in 2017 to 1.65 crore by May 2026. The Government describes this expansion as an indicator of greater formalisation of the economy. Press Information Bureau
Evidence: The taxpayer base has grown by roughly 2.5 times since GST was introduced.
Implication: The addressable universe of formally registered businesses has become substantially larger, increasing the potential pool of businesses that can be identified and targeted for B2B products and services.
Finding 2 – New taxpayer formation is concentrated in a relatively small group of states
FY 2023–24 data shows Uttar Pradesh, Maharashtra, Gujarat, Tamil Nadu and Karnataka among the leading states for new taxpayers. Uttar Pradesh recorded 8.58 lakh, while Maharashtra recorded 8.29 lakh new taxpayers. GST Tutorial
Evidence: The top states significantly outpace smaller markets in absolute new-taxpayer additions.
Implication: A national B2B strategy should not automatically distribute prospecting resources equally across all states. Geographic prioritisation can produce a more focused market-selection strategy.
Finding 3 – Large business markets are also major sources of new formal registrations
The leading states are not simply large existing GST markets; they also recorded substantial numbers of new taxpayers. Maharashtra recorded 8.29 lakh, Gujarat 5.40 lakh, Tamil Nadu 5.31 lakh, and Karnataka 4.60 lakh new taxpayers in FY 2023–24. GST Tutorial
Evidence: Established commercial centres continue to generate substantial new taxpayer activity.
Implication: B2B companies do not necessarily need to choose between established markets and new-business opportunities. Major commercial states can provide both a large existing business universe and continued inflow of new taxpayers.
Finding 4 – Geographic opportunity becomes more meaningful when moved from state to city
State-level data identifies broad concentrations of business activity, but a state can contain very different commercial environments.
For a B2B company, the useful progression is therefore:
India → State → City → Industry → Business
Evidence: GSTN’s state-level data demonstrates significant geographic variation in new taxpayer formation. GST Tutorial
Implication: Businesses looking to act on these market signals need increasingly granular business information rather than relying solely on national or state-level statistics.
Finding 5 -GST registration is a useful indicator, but not a complete measure of business activity
GST registration data should be interpreted carefully. A registration does not automatically mean that a business is currently active, generating revenue, or commercially attractive.
GSTN itself notes that registration statistics and taxpayer measures can involve cancellations, revocations and other changes. GSTN
Evidence: GSTN’s published statistics distinguish between new taxpayers and net registration changes.
Implication: GST registration data is best used as a market-intelligence signal, which should then be combined with business-level information for prospecting and targeting.
Finding 6 – The opportunity is not just in measuring business formation, but in identifying the businesses behind it
Market statistics can show that a state or industry is experiencing substantial formal business activity. They do not, by themselves, provide a practical prospecting list.
This creates an important distinction:
Market research identifies where opportunity is emerging. Business data helps identify which businesses to approach.
Implication: For B2B sales and marketing teams, the value of registration intelligence increases when it can be translated into specific businesses, locations and target markets.
1.3 What the Findings Mean for Businesses
The growth and geographic distribution of GST taxpayers point to a broader shift in how B2B companies can approach market selection.
1. Prioritise markets instead of treating India as one market
The concentration of new taxpayer activity across major states suggests that businesses can use geographic signals to determine where sales and marketing resources deserve greater attention.
A national strategy can therefore begin with:
State selection → City selection → Industry selection → Business identification
2. Look beyond the existing business universe
New taxpayer activity represents an additional layer of potential commercial opportunity.
A newly registered business may require a range of products and services as it establishes operations—from accounting and technology to banking, insurance, logistics, marketing, equipment and professional services.
However, new registration does not equal a qualified lead. The commercial value comes from identifying relevant businesses and matching them against a company’s ideal customer profile.
3. Convert market intelligence into business-level targeting
The report’s central commercial takeaway is straightforward:
Knowing where businesses are forming is useful. Knowing which businesses to approach is actionable.
For B2B companies, this means moving from aggregate market statistics toward increasingly granular targeting:
India
↓
State
↓
City
↓
Industry / Business Category
↓
Individual Business
↓
Lead Generation & Outreach
This is the point where market research and business databases become complementary rather than separate activities.
Data note: This report distinguishes between new taxpayers, total GST taxpayers and net changes in GST registrations. These measures are not interchangeable. State-wise new-taxpayer analysis is based on GSTN’s published FY 2023–24 dataset, while the latest national taxpayer-base figure is from May 2026. Where 2026 state-level new-registration data is not available in an equivalent official dataset, the report does not present estimates as official figures.
2. India’s New GST Registration Landscape
India’s GST registration base has expanded substantially since the introduction of GST in July 2017. This expansion provides an important lens for understanding the increasing formalisation of business activity across the country. However, the distinction between total active taxpayers, new registrations, and net changes in registrations is critical when interpreting the data.
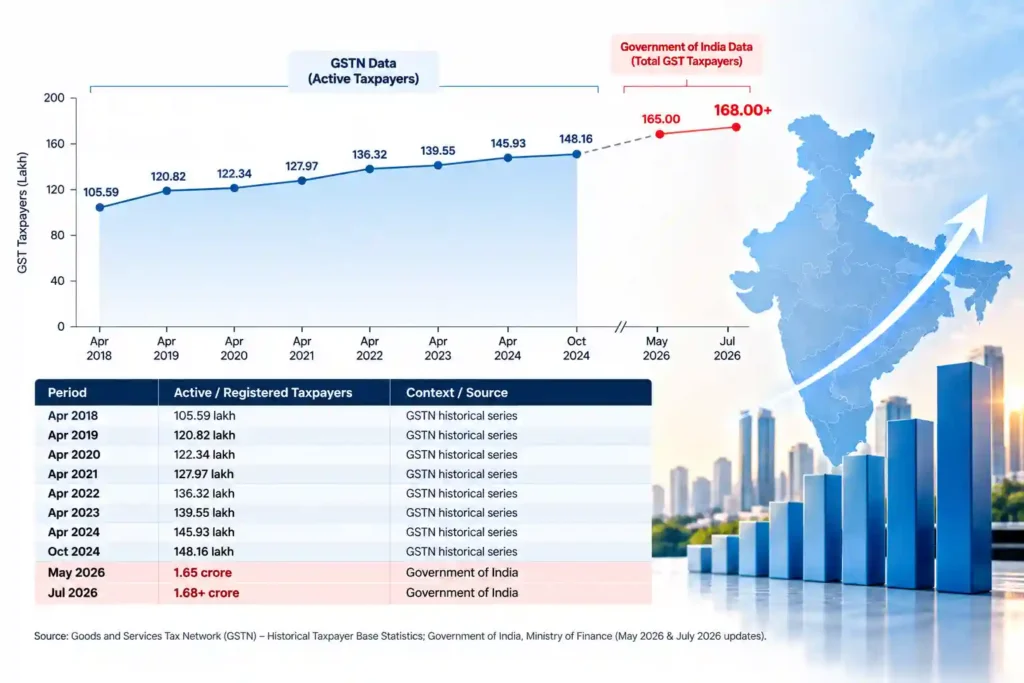
GSTN’s published statistics show that the active taxpayer base increased from 105.59 lakh in April 2018 to 145.93 lakh in April 2024, reaching 148.16 lakh by October 2024. More recently, the Government of India reported that the number of GST taxpayers had reached 1.65 crore by May 2026 and more than 1.68 crore by July 2026. GSTN
This sustained expansion provides the national context for examining where new business activity is emerging.
2.1 Registration Activity Over Time
A steadily expanding formal taxpayer base
The GST system has expanded considerably since its introduction. GSTN’s historical data shows a consistent increase in the number of active taxpayers over the period for which comparable figures are available. The active taxpayer base rose from 105.59 lakh in April 2018 to 120.82 lakh in April 2019, before reaching 136.32 lakh in April 2022, 139.55 lakh in April 2023 and 145.93 lakh in April 2024. GSTN
By May 2026, the national taxpayer count had reached 1.65 crore, and the Government subsequently reported more than 1.68 crore registered taxpayers as of July 2026. Press Information Bureau
GST taxpayer base over time
| Period | Active / Registered Taxpayers | Context |
|---|---|---|
| Apr 2018 | 105.59 lakh | GSTN historical series |
| Apr 2019 | 120.82 lakh | GSTN historical series |
| Apr 2020 | 122.34 lakh | GSTN historical series |
| Apr 2021 | 127.97 lakh | GSTN historical series |
| Apr 2022 | 136.32 lakh | GSTN historical series |
| Apr 2023 | 139.55 lakh | GSTN historical series |
| Apr 2024 | 145.93 lakh | GSTN historical series |
| Oct 2024 | 148.16 lakh | GSTN historical series |
| May 2026 | 1.65 crore | Government of India |
| Jul 2026 | 1.68+ crore | Government of India |
Source: GSTN; Government of India, Ministry of Finance. GSTN
What the trend indicates
The important point is not simply that the number has increased. The expansion of the GST taxpayer base indicates that the population of businesses participating in the formal tax ecosystem has become substantially larger.
The Government of India describes the growth in the taxpayer base as an indicator of deeper formalisation of the economy. Press Information Bureau
For B2B businesses, this matters because a larger formal taxpayer universe creates a broader pool of identifiable businesses that can potentially be segmented by geography, business category and other characteristics.
2.2 Understanding New Business Formation
GST registration data is valuable because it provides visibility into businesses entering India’s formal tax framework. But registration activity and business activity are not the same thing.
A GST registration can indicate that an entity has entered the GST system, but it should not automatically be interpreted as:
• a currently active business;
• a unique operating company;
• a measure of revenue;
• a measure of business size;
• a qualified sales lead; or
• evidence that a business is commercially viable.
This distinction becomes particularly important when analysing new registrations.
GSTN’s published registration statistics explicitly account for changes such as cancellations and revocations, meaning that a simple change in the number of registrations cannot automatically be treated as the number of new businesses entering the market. GSTN, for example, reported that its August 2024 net new-registration figure was calculated after accounting for cancellation and retrospective revocation activity. GSTN
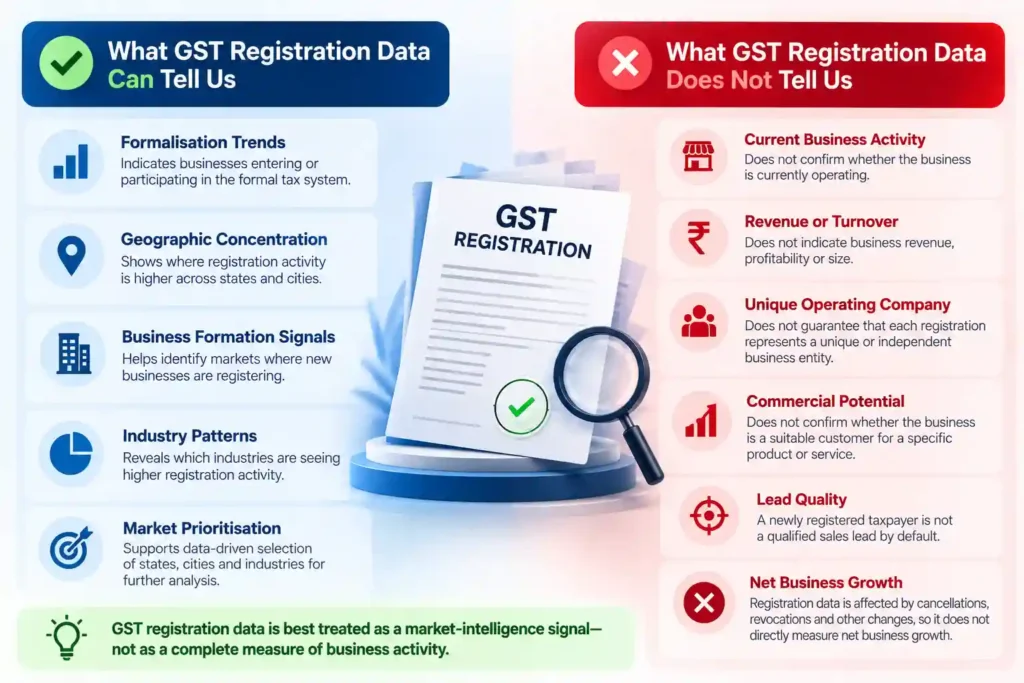
What GST registration data can tell us
Formalisation
It provides an indication of businesses entering or participating in the formal tax system.
Geographic concentration
State-level registration data can reveal where formal business activity is concentrated.
Business formation signals
New-taxpayer data can help identify markets where additional businesses are entering the formal ecosystem.
Market prioritisation
When combined with geography and business-category information, registration data can help businesses identify markets worth investigating further.
What it cannot tell us on its own
Business activity
Registration does not prove that an entity is currently operating at a particular level.
Commercial potential
A registration does not tell us whether the business is a suitable customer for a particular B2B product.
Revenue or size
Registration data alone does not establish turnover, profitability or purchasing power.
Lead quality
A newly registered taxpayer is not automatically a qualified sales prospect.
The correct interpretation
GST registration data is best treated as a market-intelligence signal-not as a complete measure of business activity.
This distinction is central to the report. The objective is not to claim that every registration represents a new commercial opportunity. Instead, registration patterns can help identify where formal business activity is emerging, after which more granular business data can be used to investigate the businesses within those markets.
2.3 Key National Takeaways
1. India’s formal GST taxpayer universe has expanded substantially
The active taxpayer base increased from 105.59 lakh in April 2018 to 145.93 lakh in April 2024, while the Government reported 1.65 crore taxpayers by May 2026 and more than 1.68 crore by July 2026. GSTN
This represents a significantly larger formal business universe than existed during the early years of GST.
2. Growth in registrations provides a useful formalisation signal
The Government of India identifies the expansion of the GST taxpayer base as evidence of deeper economic formalisation. Press Information Bureau
For businesses, this means the GST ecosystem has become increasingly relevant as a source of information about India’s formal business landscape.
3. Total taxpayer growth and new registrations must not be confused
A growing taxpayer base does not mean that every increase represents newly established businesses. Cancellations, revocations and other registration changes affect the net number.
For this reason, this report separates:
Total taxpayer base
from
New taxpayer registrations
from
Net registration changes
This distinction allows the subsequent state-level analysis to use the appropriate measure rather than treating all GST statistics as interchangeable.
4. National statistics become more useful when they are geographically and commercially segmented
The national taxpayer count tells us the scale of the formal business universe.
It does not tell a B2B company:
Which states should we target?
Which cities should we prioritise?
Which businesses should we approach?
Those questions require progressively more granular analysis.
This leads to the next stage of the report:
India → State → City → Business
For businesses that want to move from national GST market intelligence to geographic targeting, EMarket Zone provides state-wise GST business data and city-wise GST business data.
5. GST data is most valuable when combined with business-level intelligence
The national trend establishes the size and continued expansion of India’s formal taxpayer ecosystem. The next question is more practical:
Where is this new business activity concentrated?
The following chapter examines this question at the state level, identifying the states recording the largest numbers of new taxpayers and examining what those geographic differences may mean for B2B market prioritisation.
Sources: Goods and Services Tax Network (GSTN), GSTN Brochure / Taxpayer Base Statistics; GSTN, 7 Years of GST; GSTN Annual Report 2023–24; Government of India, Ministry of Finance / Press Information Bureau, 2026 GST updates.
3. State-wise Business Formation
The national GST taxpayer trend establishes the scale of India’s formal business ecosystem. The next question is more commercially relevant: where is new taxpayer activity concentrated?
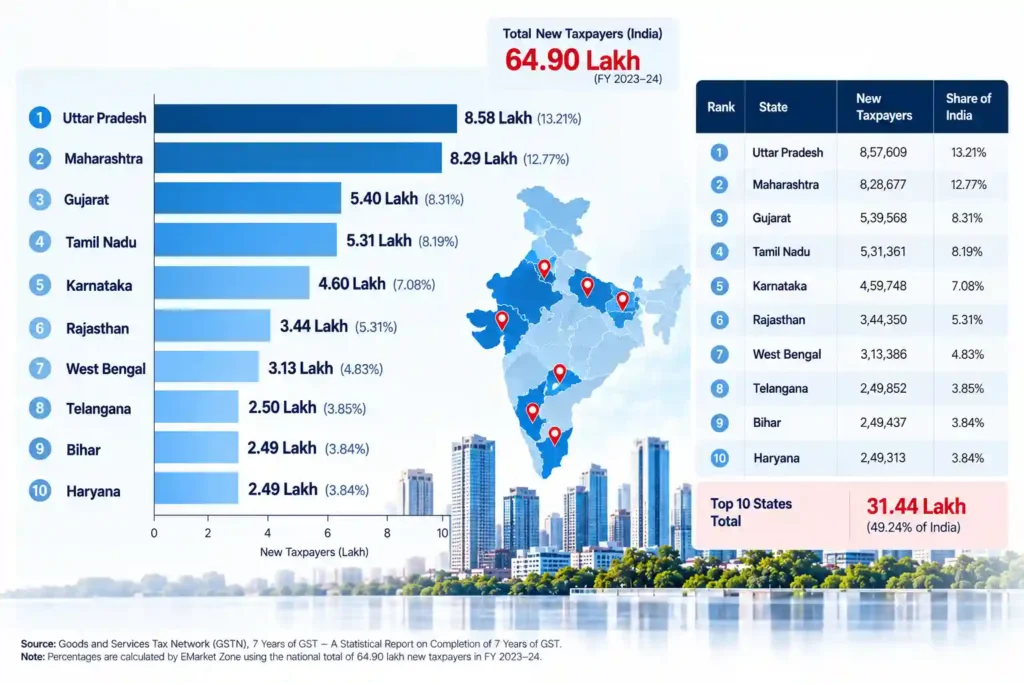
GSTN’s 7 Years of GST statistical report provides state-wise data on new taxpayers registered during FY 2023–24, giving a comparable basis for examining geographic differences in business formation. The dataset records 64.90 lakh new taxpayers nationally during the year. GST Tutorial
This section uses that measure rather than the total GST taxpayer base. That distinction matters: a state with a large existing taxpayer base is not necessarily the state adding the most new taxpayers.
3.1 States Leading New GST Registrations
New taxpayer activity is concentrated across India’s major commercial markets
The FY 2023–24 data shows a clear concentration of new taxpayer registrations among a relatively small group of states. Uttar Pradesh and Maharashtra were the two largest contributors, each recording more than 8 lakh new taxpayers during the year.
Uttar Pradesh recorded 8.58 lakh new taxpayers, followed by Maharashtra with 8.29 lakh. Gujarat, Tamil Nadu and Karnataka formed the next tier, each recording more than 4.5 lakh new taxpayers. GST Tutorial
Top 10 states by new taxpayers, FY 2023-24
| Rank | State | New taxpayers | Share of national new taxpayers |
|---|---|---|---|
| 1 | Uttar Pradesh | 8,57,609 | 13.21% |
| 2 | Maharashtra | 8,28,677 | 12.77% |
| 3 | Gujarat | 5,39,568 | 8.31% |
| 4 | Tamil Nadu | 5,31,361 | 8.19% |
| 5 | Karnataka | 4,59,748 | 7.08% |
| 6 | Rajasthan | 3,44,350 | 5.31% |
| 7 | West Bengal | 3,13,386 | 4.83% |
| 8 | Telangana | 2,49,852 | 3.85% |
| 9 | Bihar | 2,49,437 | 3.84% |
| 10 | Haryana | 2,49,313 | 3.84% |
Source: GSTN, 7 Years of GST; EMarket Zone calculation of national shares using 64.90 lakh new taxpayers as the denominator. GST Tutorial
The top 10 states together account for approximately 49.2% of all new taxpayers recorded nationally in FY 2023–24. This is an important finding: almost half of the year’s new-taxpayer activity was concentrated in just ten states.
What this concentration tells us
The pattern reflects the fact that India’s business formation is not evenly distributed geographically. Large and commercially active states can simultaneously offer:
- a substantial existing business universe;
- continued inflow of new taxpayers;
- multiple major cities and commercial centres; and
- diverse industry clusters.
For B2B companies, this means a national market should not necessarily be approached as a uniform opportunity pool.
The more useful question is:
Which states combine scale with continued new-business formation?
That question becomes particularly important when a company is allocating sales territories, deciding where to run outbound campaigns, or selecting markets for lead-generation activity.
3.2 Regional Distribution
Looking at individual states shows concentration, but regional grouping provides another perspective on India’s business geography.
For this analysis, states can be grouped into the following broad regions:
• North
• South
• West
• East
• Northeast
The purpose is not simply to identify the largest region. Regional analysis helps determine whether new taxpayer activity is broadly distributed across India or disproportionately concentrated within particular economic corridors.
A geographically diversified but uneven market
The leading states demonstrate that new taxpayer formation is present across multiple regions.
The North is represented strongly by Uttar Pradesh, Rajasthan and Haryana.
The West is led by Maharashtra and Gujarat.
The South includes Tamil Nadu, Karnataka and Telangana among the major contributors.
The East is represented prominently by West Bengal and Bihar.
This means the opportunity is not confined to a single geographic corridor. However, the scale within individual states differs substantially, which is why state-level analysis remains more useful for commercial targeting than a simple national or regional comparison. GST Tutorial
Regional lens for B2B market selection
| Region | Major states appearing among the leading markets | B2B interpretation |
|---|---|---|
| North | Uttar Pradesh, Rajasthan, Haryana | Large and diverse business markets |
| West | Maharashtra, Gujarat | Strong commercial and industrial concentration |
| South | Tamil Nadu, Karnataka, Telangana | Multiple major business and technology centres |
| East | West Bengal, Bihar | Significant and expanding formal business base |
| Northeast | Smaller individual state markets | More specialised geographic opportunities |
Important methodological note: The table above is a market-interpretation framework, not a regional ranking. A defensible regional ranking should be calculated from the complete state-level dataset rather than summing only the top states shown in this report.
Why regional concentration matters
A B2B company deciding where to expand cannot rely solely on the total number of businesses in India.
Suppose two states both contain significant business populations. If one is adding substantially more new taxpayers, that may indicate a different type of opportunity for companies selling products or services to newly formalised businesses.
At the same time, new registrations should not be treated as direct evidence of demand. They are a signal that needs to be combined with industry, city and business-level information.
The strategic value therefore comes from moving from:
Regional opportunity
to
State opportunity
to
City opportunity
to
Business-level targeting
3.3 Geographic Opportunity for B2B Companies
The state-level findings point to a simple but important principle:
A national market can appear attractive at an aggregate level while the commercially relevant opportunity is concentrated within a much smaller number of states and cities.
For B2B companies, geographic targeting can therefore be structured as a sequence.
India → State → City → Business
India
Start with the national market and identify the overall scale of formal business activity.
↓
State
Prioritise states based on business concentration, new taxpayer activity, industry relevance and strategic fit.
↓
City
Move beyond state averages to identify the specific commercial centres where target businesses are concentrated.
↓
Business
Identify the individual businesses that match the company’s ideal customer profile.
↓
Lead Generation
Use business-level information to build targeted prospecting and outreach campaigns.
Why this matters
A company selling accounting software, logistics services, industrial equipment, insurance, banking products or B2B technology does not need to reach every newly registered taxpayer in India.
It needs to identify:
Which businesses in which markets are relevant to its offering?
That is where market research and business-level data become complementary.
The research identifies where business formation is occurring. Business data helps companies move toward which businesses to approach.
For companies looking to narrow national market research into specific geographic prospecting opportunities, EMarket Zone provides state-wise GST business data and city-wise GST business data.
From geographic intelligence to targeted markets
The practical workflow can therefore be represented as:
New GST activity
↓
Identify high-opportunity states
↓
Prioritise relevant cities
↓
Filter by business/industry requirements
↓
Identify potential businesses
↓
Build targeted B2B outreach
This approach is more useful than treating GST registration numbers as a standalone sales list.
Key Takeaways
1. New taxpayer activity is geographically concentrated
The top 10 states accounted for approximately 49.2% of India’s 64.90 lakh new taxpayers in FY 2023–24, demonstrating substantial geographic concentration. GST Tutorial
2. Uttar Pradesh and Maharashtra lead the national ranking
Both states recorded more than 8 lakh new taxpayers, putting them significantly ahead of the next group of states. GST Tutorial
3. Multiple regions contribute to India’s business formation
Major markets exist across North, West, South and East India. The opportunity is therefore broad geographically, but uneven in scale.
4. State-level statistics are only the first layer
For actual B2B targeting, state-level numbers need to be narrowed to cities, industries and individual businesses.
5. New registration data is a market signal-not a lead list
The commercial value comes from combining registration intelligence with business-level information and a defined ideal customer profile.
Source
Primary source: Goods and Services Tax Network (GSTN), 7 Years of GST — A Statistical Report on Completion of 7 Years of GST. GST Tutorial
Data note: The state ranking in this chapter uses GSTN’s FY 2023–24 new taxpayer measure. The percentage shares are EMarket Zone calculations using the reported national total of 64.90 lakh new taxpayers. We should not describe these figures as “2026 new registrations”; the latest comparable state-wise dataset currently being used here is FY 2023–24. That distinction should remain explicit throughout the report.
4. Industry-wise Business Formation
The geographic analysis in the previous chapter showed where new GST taxpayers were being added. The next question is more commercially relevant:
What types of businesses are entering the formal tax system?
Industry-level analysis can help identify the business categories behind registration activity and, when combined with state-level data, reveal where particular types of businesses are concentrated.
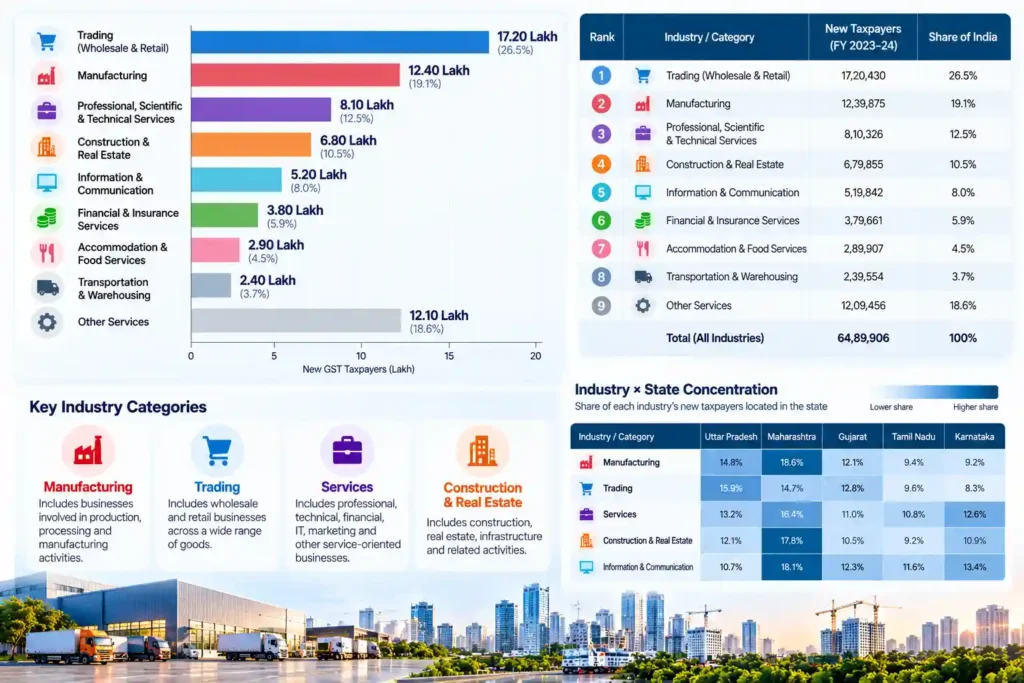
However, there is an important data limitation that should be made explicit. The GSTN FY 2023–24 “7 Years of GST” report provides state-wise new-taxpayer counts, but it does not publish a comparable national industry-wise table of new GST registrations. GST registration records do capture business activity and goods/services information, but the publicly available GSTN statistics do not provide the complete industry-by-state new-registration dataset needed to produce a defensible ranking. GST Tutorial
Therefore, this chapter should not manufacture an industry ranking from unrelated GST collection data or secondary estimates. Instead, industry analysis should be based on a clearly defined supplementary dataset where the methodology permits it.
4.1 Industries Driving New Registrations
What the available GST data tells us
GST registration applications contain business-level information, including the nature of business activity and goods/services associated with the taxpayer. The GST portal’s registration framework specifically captures the nature of business activity at the place of business and provides information related to goods and services. GST Tutorial
However, the publicly released GSTN FY 2023–24 statistical report does not provide a national table such as:
| Rank | Industry | New Registrations | Share | Trend |
|---|---|---|---|---|
| 1 | — | — | — | — |
| 2 | — | — | — | — |
| 3 | — | — | — | — |
| 4 | — | — | — | — |
| 5 | — | — | — | — |
Consequently, an industry ranking cannot currently be presented as an official FY 2023–24 new-GST-registration ranking without access to the underlying registration-level dataset.
This distinction matters because GST collections by industry, GST registrations by state, and registrations of companies/startups are different measures.
What can be concluded
The available evidence supports a more cautious interpretation:
• GST registration provides a framework for identifying the nature of business activity.
• The national GSTN publication allows strong state-wise analysis of new taxpayers.
• Industry-level analysis requires an additional dataset or registration-level classification.
• Industry rankings should therefore be presented only when the underlying dataset and classification methodology are disclosed.
Research principle: Where the official data does not support a ranking, the report should show the limitation rather than convert an assumption into a statistic.
4.2 Emerging Business Categories
Not every increase in representation should be described as “growth.”
A category can have a large number of registrations without necessarily being the fastest-growing category. Similarly, an increase in the number of registered taxpayers does not automatically mean that the underlying industry’s revenues, employment, investment, or commercial activity increased at the same rate.
For this reason, the report uses three separate concepts:
Established categories
These are business categories with a substantial existing presence in the formal economy.
A large registration base can indicate a broad addressable market, but size alone does not establish recent growth.
Emerging categories
An emerging category should ideally satisfy at least one measurable condition:
• increasing registrations over a defined period;
• increasing share of total registrations;
• increasing representation across states;
• or a demonstrable increase in newly registered enterprises.
Without one of these comparisons, the category should be described as “represented” or “prominent”, rather than “fast-growing.”
Service, trading and manufacturing patterns
GST registration data can also be analysed according to broad activity groupings such as:
Services → Trading → Manufacturing
This classification can be useful for B2B targeting because the commercial requirements of each group differ.
For example:
• Services may create opportunities for software, professional services, financial products and business support.
• Trading businesses may have stronger requirements around distribution, procurement, logistics and supplier relationships.
• Manufacturing businesses may create demand across industrial supplies, machinery, raw materials, logistics and other B2B categories.
These are commercial interpretations, not claims about the relative growth rates of these sectors.
Why this distinction matters
A useful industry analysis should answer three different questions:
How large is the category?
Is its representation increasing?
Where is that activity concentrated?
Only when the underlying data answers all three can an industry be confidently described as a growth opportunity.
4.3 Industry × Geography
The strongest application of industry data is not an industry ranking by itself.
It is the intersection of industry and location.
A national ranking might tell a company that a particular category has many businesses. But a B2B sales team needs a more specific answer:
Where are those businesses located?
The analytical framework should therefore move from:
India → State → Industry → Business
For example:
| Industry | Leading State | Second | Third |
|---|---|---|---|
| Manufacturing | To be established from underlying dataset | — | — |
| Trading | To be established from underlying dataset | — | — |
| Services | To be established from underlying dataset | — | — |
These values should be populated only after the underlying industry-classified registration dataset is available.
Why industry × geography is more actionable
Consider two markets with the same number of newly registered businesses.
If one market is dominated by trading businesses while another has a greater concentration of manufacturing businesses, they represent very different B2B opportunities.
A supplier of industrial machinery may prioritize one geography.
A SaaS company may prioritize another.
A logistics provider may need a third.
This is why industry concentration and geographic concentration should be analysed together rather than independently.
Recommended analytical framework
Once industry-level registration data is available, the report can calculate:
Industry share
\[ \text{Industry Share} = \frac{\text{New registrations in industry}} {\text{Total new registrations}} \times100 \]
and:
State × Industry concentration
\[ \text{State Industry Share} = \frac{\text{Industry registrations in state}} {\text{Total industry registrations}} \times100 \]
This would allow the report to identify combinations such as:
• Manufacturing → Maharashtra / Gujarat / Tamil Nadu
• Trading → Uttar Pradesh / Maharashtra / Gujarat
• Services → Karnataka / Maharashtra / Telangana
But these examples should not be presented as findings until they are calculated from the underlying dataset.
Data Integrity Note
For this report, industry-level numbers should not be inferred from GST revenue collections, company registrations, startup registrations, or generic sector reports and labelled as “new GST registrations.” Those datasets measure different populations.
For example, the Government’s public data separately publishes DPIIT-recognised startups by sector, state and year, while Udyam provides MSME registration data. These can be valuable supplementary datasets, but they should remain clearly labelled as startup registrations or MSME registrations, rather than being presented as GST registrations. Data.gov.in
The GSTN FY 2023–24 dataset confirms 64,89,906 new taxpayers nationally, with detailed state-level counts, but the publicly available report does not provide the equivalent industry-level breakdown. GST Tutorial
5. What New Business Formation Means for B2B
The value of new-business data extends beyond measuring registration activity. For B2B companies, the more important question is whether emerging businesses can help identify new markets, potential customer segments, and areas for targeted business development.
A newly registered taxpayer should not automatically be treated as a qualified prospect. Registration indicates that a business has entered or formalised within the GST system, but it does not establish its revenue, purchasing capacity, current activity, or willingness to buy.
The commercial opportunity lies in using business-formation data as a market-selection signal and then applying additional business-level criteria to build a relevant prospect universe.
5.1 Why Newly Registered Businesses Matter
Business formation can create demand across a wide range of B2B categories.
A newly established or newly formalised business may need to arrange essential services, technology, infrastructure, suppliers, and professional support as it begins or expands operations.
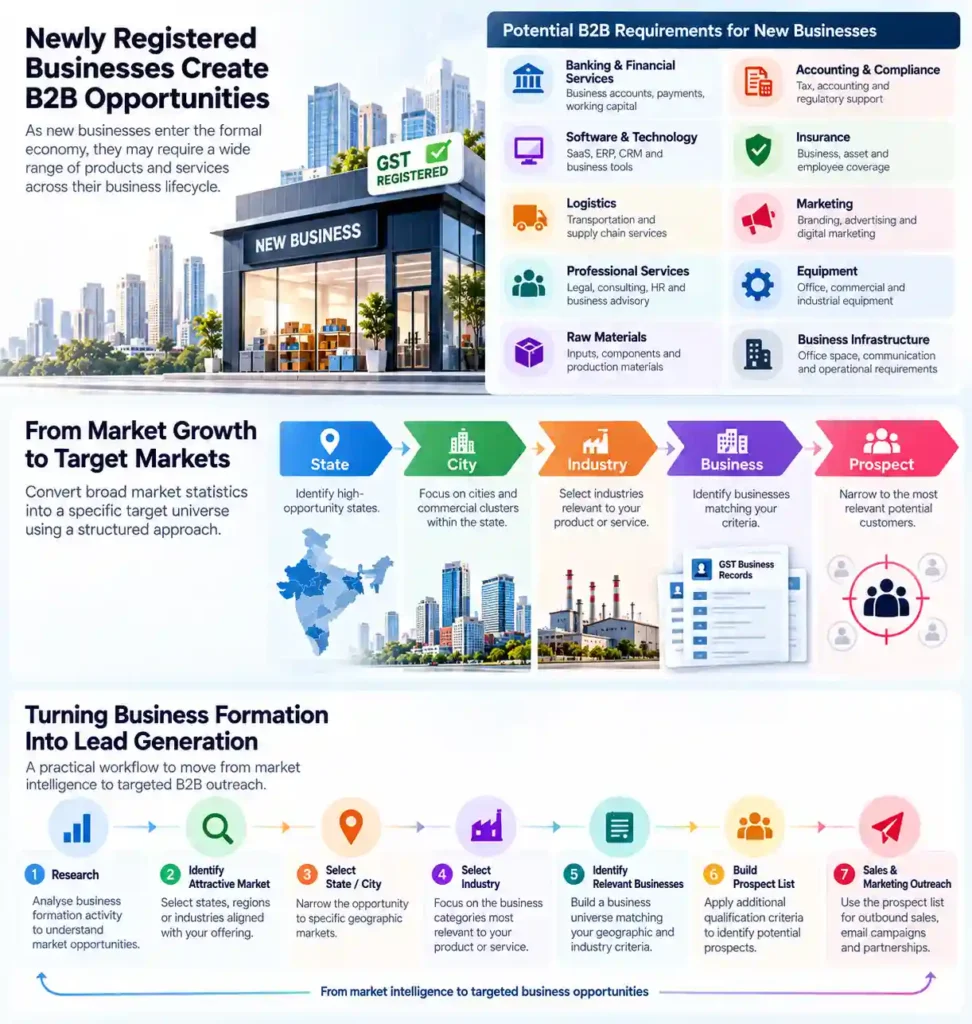
Potential requirements can include:
| B2B Category | Potential Business Requirement |
|---|---|
| Banking & Financial Services | Business accounts, payments, working capital and financial products |
| Accounting & Compliance | Tax, accounting, compliance and regulatory support |
| Software & Technology | SaaS, ERP, CRM, communication and business technology |
| Insurance | Business, asset, employee and liability coverage |
| Logistics | Transportation, warehousing and supply-chain services |
| Marketing | Branding, advertising, digital marketing and lead generation |
| Professional Services | Legal, consulting, HR and business advisory services |
| Equipment | Office, commercial and industrial equipment |
| Raw Materials | Inputs, components, packaging and production materials |
| Business Infrastructure | Office, commercial, communication and operational requirements |
The exact requirements vary substantially by industry, business size, location and operating model.
A manufacturing business, for example, may have very different requirements from a professional-services firm. Similarly, a business operating in a major industrial cluster may have a different supplier ecosystem from one operating in a smaller regional market.
The commercial implication
This creates a broad B2B opportunity:
Business formation creates potential demand across multiple B2B categories.
But potential demand is not the same as qualified demand.
GST registration data can help identify where businesses are entering the formal economy. Additional business information is required to determine which businesses are relevant prospects for a particular product or service.
This distinction is critical for responsible use of business data.
5.2 From Market Growth to Target Markets
National statistics are useful for understanding the size and direction of a market.
They are much less useful for a sales team deciding:
• Which businesses should we contact
• Which cities should we prioritise?
• Which industries should we focus on
• Where should our sales team expand?
• Which markets deserve a targeted campaign?
The answer requires progressively narrowing the market.
State → City → Industry → Business → Prospect
This targeting hierarchy converts broad market intelligence into an actionable target universe.
1. State
Identify states showing significant business-formation activity or strategic relevance to the company’s offering.
2. City
Move from the state level to the cities and commercial clusters where relevant businesses are concentrated.
This is particularly important because business activity within a state is rarely distributed evenly.
For a B2B company, targeting an entire state can create a large and inefficient universe. City-level segmentation can make campaigns more focused and sales territories more manageable.
Explore City-wise GST Business Data →
GST Lists – City-wise
3. Industry
Identify the business categories most relevant to the product or service.
A technology provider, logistics company and industrial supplier may all need to target different parts of the same city.
4. Business
Build a universe of businesses matching the selected geographic and industry criteria.
At this stage, GST information becomes more useful when combined with additional business attributes.
5. Prospect
The final target is not simply a registered business.
It is a business that matches the company’s ideal customer profile (ICP).
That may include criteria such as:
• Industry
• Location
• Business type
• Company size
• Product relevance
• Operating characteristics
• Contact availability
• Other qualification criteria
From market size to addressable opportunity
This creates an important distinction:
Total market
↓
Geographic market
↓
Industry segment
↓
Relevant businesses
↓
Qualified prospects
Each step reduces the universe while increasing commercial relevance.
5.3 Turning Business Formation Into Lead Generation
Market research becomes commercially useful when it can support a repeatable process for identifying and prioritising potential customers.
A practical B2B workflow can be represented as:
Research
Analyse business-formation activity to understand where new commercial activity is emerging.
↓
Identify Attractive Market
Select states, regions or business categories that align with the company’s products, services and expansion strategy.
↓
Select State / City
Narrow the opportunity to specific geographic markets rather than targeting an entire country.
↓
Select Industry
Define the industries or business categories that are most relevant to the offering.
↓
Identify Relevant Businesses
Build a business universe matching the selected geographic and industry criteria.
↓
Build Prospect List
Apply additional qualification and contact criteria to identify businesses that can realistically be approached.
↓
Sales & Marketing Outreach
Use the resulting prospect universe for appropriate channels such as outbound sales, account-based marketing, email campaigns, partnerships or territory development.
From research to prospecting
The key principle is that market intelligence and lead generation are connected, but they are not the same thing.
Market intelligence answers:
Where is business activity emerging?
Business data helps answer:
Which businesses are operating in that market?
Lead generation then asks:
Which of those businesses should we approach?
This progression is particularly important for companies operating across multiple states or cities. Instead of applying the same sales strategy to the entire Indian market, businesses can use geographic and industry signals to create more focused prospecting universes.
The EMarket Zone opportunity
This is where structured GST and business data can become an operational resource.
EMarket Zone’s databases can be used to move from a broad market question—“Where are businesses being formed?”—toward a more specific commercial question:
“Which businesses in the markets we care about should we target?”
The value is therefore not simply in the number of records.
It is in the ability to segment the business universe by geography and business characteristics, creating a more relevant starting point for B2B sales and marketing.
Market intelligence identifies the opportunity. Business data helps locate it. Prospecting turns it into action.
6. From Market Intelligence to Business Leads
The preceding chapters examined where new business activity is emerging, which markets are significant, and how business formation can create potential B2B demand.
The next step is to translate that research into a usable business-development framework.
The central distinction is simple:
Market intelligence identifies the opportunity. Business data helps identify the businesses within that opportunity.
6.1 The Gap Between Market Data and Business Data
Market research and business data answer different questions.
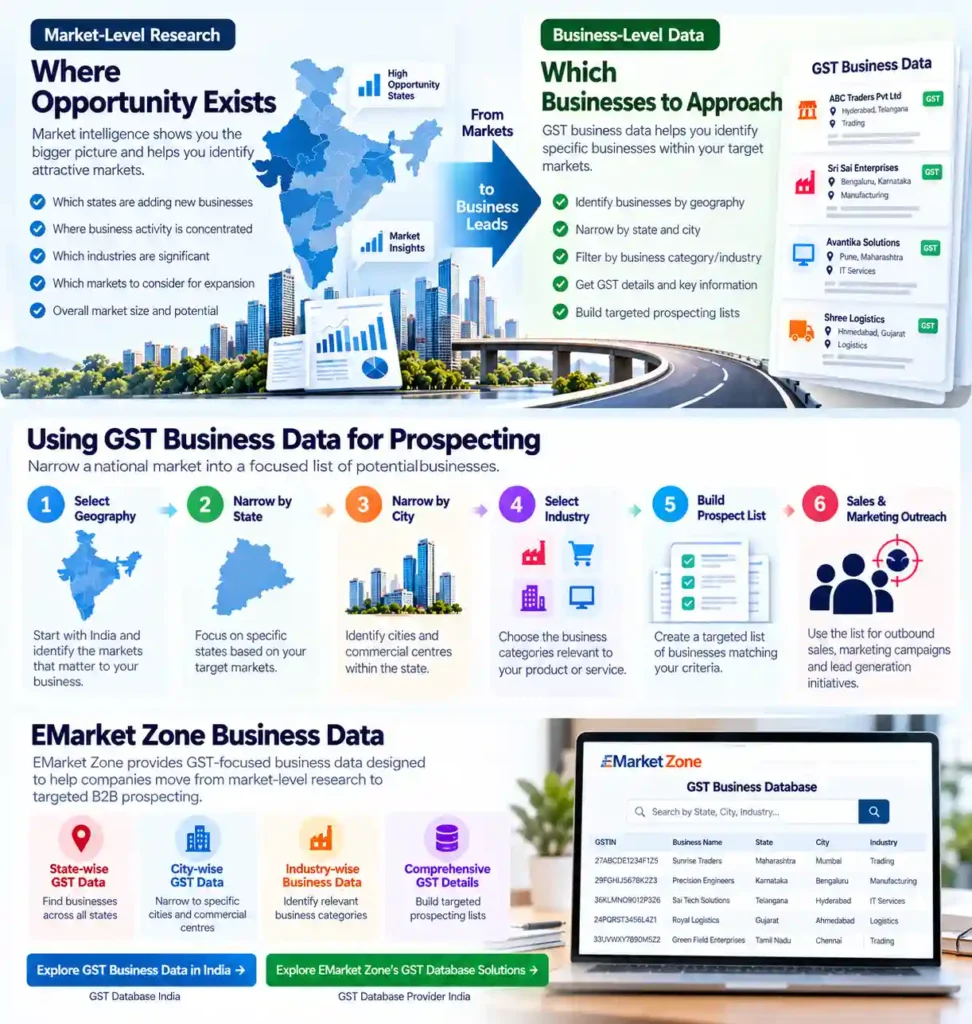
Market-level research tells you:
Where opportunity exists.
It can reveal:
• Which states are adding significant numbers of taxpayers
• Which markets are commercially important
• Where business formation is concentrated
• Which industries or regions deserve further investigation
• Where a company may consider expanding its sales effort
But market-level statistics generally stop at the market level.
Knowing that Maharashtra or Uttar Pradesh has significant business activity does not, by itself, provide a sales team with a list of businesses to contact.
Business-level data helps you determine:
Which businesses to approach.
Business-level datasets can provide a more granular view of the market by allowing companies to identify businesses according to relevant attributes such as:
• Geography
• State
• City
• Business category
• GST-related information
• Other available business characteristics
This creates a progression:
Market Research
↓
Market Selection
↓
Business Identification
↓
Prospect Qualification
↓
Sales & Marketing
The commercial gap
A market can be attractive without every business in that market being a suitable customer.
For example, a company may identify a state as a high-priority market but only want to target:
one city + one industry + businesses matching a specific customer profile.
That is the point at which broad market intelligence needs to be supplemented by structured business data.
Market data tells you where to look. Business data helps you build the universe of businesses to evaluate.
6.2 Using GST Business Data for Prospecting
GST-focused business data can provide a practical starting point for companies that need to identify businesses across specific markets.
A typical prospecting process can be structured around several levels of segmentation.
1. Identify businesses by geography
Start with the markets that matter to the business.
For example:
India → State → City
This allows a national market to be narrowed into manageable sales territories.
2. Narrow by state
State-level segmentation can help sales and marketing teams prioritise specific geographic markets based on their market research, distribution strategy or expansion plans.
3. Narrow by city
City-level segmentation provides another layer of precision.
This can be particularly useful when business activity is concentrated in specific commercial centres rather than distributed evenly across a state.
4. Identify relevant business categories
The geographic universe can then be narrowed according to the business categories relevant to the company’s offering.
A logistics provider, software company, industrial supplier and professional-services firm may each require a different target universe.
5. Build targeted B2B prospecting lists
The resulting business universe can then serve as a starting point for creating targeted prospecting lists.
The objective is not simply to maximise the number of records.
It is to create a more relevant pool of potential accounts that can subsequently be qualified according to the company’s ideal customer profile.
6. Support sales and marketing campaigns
Structured business data can support activities such as:
• B2B sales prospecting
• Territory expansion
• Account identification
• Market-entry research
• Outbound campaigns
• Lead-generation initiatives
• Geographic segmentation
• Industry-focused marketing
The quality of the resulting campaign still depends on how the data is filtered, validated, qualified and used.
Explore GST Business Data in India →
GST Database India
6.3 EMarket Zone Business Data
The research in this report demonstrates the value of understanding business formation at the national, state, industry and geographic levels.
The next step is turning those insights into a more specific business universe.
EMarket Zone provides business data designed to help companies move from market-level research to targeted B2B prospecting. Businesses can explore GST-focused datasets by geography and use them to identify potential accounts across their target markets.
The approach can be summarised as:
Research → Segment → Identify → Qualify → Approach
Rather than treating a database as a replacement for market research, it can be used as the operational layer that follows market research.
For example:
Research identifies a high-potential state
→
City analysis identifies priority commercial markets
→
Business data identifies relevant businesses
→
Qualification identifies potential accounts
→
Sales and marketing engage those accounts
This creates a more structured connection between market intelligence and lead generation.
Business data as an operational layer
The distinction is important:
Market Intelligence
Where should we focus?
↓
Business Data
Which businesses are in that market?
↓
Prospecting
Which businesses should we approach?
↓
Sales & Marketing
How should we engage them?
This is the role that structured GST business data can play in a B2B growth strategy.
Explore EMarket Zone’s GST Database Solutions →
GST Database Provider India
A final qualification principle
GST-related business data should be treated as a prospecting and market-identification resource, not as a guarantee that every record represents an active buyer or qualified lead.
The strongest results come when businesses combine:
Reliable business data + clear targeting criteria + prospect qualification + relevant outreach.
That is how market intelligence can move from a research finding to a practical B2B growth activity.
7. Methodology & Data Sources
This report is designed to distinguish clearly between official GST statistics, calculated indicators, and commercial interpretation. The objective is to ensure that every ranking, percentage and conclusion can be traced back to an identifiable source or calculation.
Where the available public data does not support a conclusion, the report does not present an estimate as an official statistic.
7.1 Research Methodology
Research period
The report uses data from multiple reference periods because the available GST datasets serve different analytical purposes.
• FY 2023–24 – primary period for the detailed state-wise analysis of new taxpayers.
• April 2018–October 2024 – historical active-taxpayer series used to illustrate the development of the GST taxpayer base.
• May–July 2026 – latest national GST taxpayer-base context available from Government of India sources at the time of publication.
• October 2026 – report publication date.
The report does not combine these periods into a single time series where the underlying definitions or measurement points differ.
Geographic coverage
The research covers India at the national and state/Union Territory levels.
State-level rankings are based on the GSTN-published FY 2023–24 table of new taxpayers. The GSTN report records 64,89,906 new taxpayers across India for the period. GST Tutorial
City-level business targeting is discussed as a practical commercial application of the research rather than as a claim that the public GSTN report provides a complete city-wise new-registration dataset.
Data collection
Primary research relies principally on official sources, including:
- Goods and Services Tax Network (GSTN)
- Government of India
- Press Information Bureau (PIB)
- GSTN statistical and statutory publications
The GSTN “7 Years of GST” statistical report provides the state-wise FY 2023–24 new-taxpayer dataset used for the principal state rankings. GST Tutorial
The GSTN Annual Report 2023–24 provides additional registration statistics and definitions around the GST taxpayer system. GSTN
Data cleaning
Before analysis, source data was reviewed for:
- State-name spelling and naming inconsistencies
- Duplicate geographic labels
- Numerical formatting
- Missing observations
- Differences between taxpayer counts and net registration changes
- Differences between historical and current measurement periods
For example, the GSTN statistical report uses variations such as “Gujrat” and “Maharastra” in its source table; these are standardised to Gujarat and Maharashtra in the report without changing the underlying values. GST Tutorial
Categorisation
Geographic categories follow the state/Union Territory classifications used in the underlying government dataset.
Industry-level classifications are used only where a reliable underlying dataset supports the classification. Industry categories are not inferred from GST revenue data and then presented as new GST registrations.
This distinction is important because taxpayer registrations, tax collections, company registrations, startup registrations and MSME registrations represent different datasets and populations.
Calculations
Where percentages are not directly published by the source, they are calculated from the underlying figures.
For example:
\[ \text{State Share} = \frac{\text{State New Taxpayers}} {\text{India New Taxpayers}} \times100 \]
The national denominator used for the principal FY 2023–24 state analysis is 64,89,906 new taxpayers. GST Tutorial
Rounded values may therefore produce minor differences when percentages are added together.
Ranking methodology
States are ranked according to the number of new taxpayers recorded in FY 2023–24, not according to:
- GST revenue
- total active taxpayers
- net registrations
- GDP
- number of companies
- number of MSMEs
This distinction is important because a state’s position can differ significantly depending on which metric is being measured.
Treatment of missing or unsupported data
Where a required public dataset is unavailable, the report does not create a proxy and label it as the original metric.
For example, the public GSTN statistical report provides detailed state-level new-taxpayer counts but does not provide an equivalent complete national industry × state new-registration table. Consequently, the report treats industry-level claims cautiously rather than presenting unsupported rankings.
10.2 Define the Commercial Objective
Different objectives require different market-intelligence strategies.
Market Entry
The organization wants to enter a new geography or industry.
Primary questions:
• Where is demand concentrated?
• Which companies dominate the segment?
• Who are the potential early customers?
• What competitors already exist?
Market Expansion
The organization already has customers and wants to expand.
Primary questions:
• Which adjacent markets resemble existing successful customers?
• Which cities or states have similar customer profiles?
• Where can existing sales capabilities be replicated?
Account-Based Growth
The organization wants to increase revenue from high-value accounts.
Primary questions:
• Which companies have the highest potential?
• Which stakeholders influence purchasing?
• What business events indicate opportunity?
Channel Development
The organization wants distributors, dealers, suppliers or strategic partners.
Primary questions:
• Where are relevant channel businesses concentrated?
• Which companies have the required geographic reach?
• Which businesses complement the company’s offering?
The intelligence required changes according to the objective.
7.2 Data Definitions & Limitations
GST registration
A GST registration represents registration within India’s Goods and Services Tax system.
It should be understood as a tax-system registration, not as a comprehensive census of every business operating in India.
New registration / new taxpayer
For this report, new taxpayers refers specifically to the measure reported by GSTN in its FY 2023–24 statistical table.
The report uses the source’s terminology rather than redefining the metric. GSTN reports 64,89,906 new taxpayers nationally for FY 2023–24. GST Tutorial
This should not automatically be interpreted as the number of newly incorporated companies or newly started businesses.
Active taxpayer
An active taxpayer is a different measure from a new taxpayer.
For example, GSTN’s historical series tracks the number of active taxpayers at particular points in time. Its Annual Report 2023–24 records 1,47,18,888 active taxpayers as of 31 August 2024. GSTN
The report therefore does not use active taxpayer, new taxpayer, and net new registration interchangeably.
Business
The term business is used in this report in a commercial context and should not be interpreted as a one-to-one equivalent of a unique legal company.
A GST registration can represent a taxable registration and does not necessarily establish:
• a unique incorporated company;
• an independent operating entity;
• current commercial activity;
• revenue level; or
• purchasing capacity.
Industry / category
Industry or category refers to the classification applied to the underlying dataset being analysed.
Different datasets may use different classification systems. Therefore, an industry ranking should only be compared when the classification methodology and underlying population are comparable.
State
State-level analysis follows the geographic units reported by GSTN, including relevant Union Territories.
City
City-level targeting represents a finer geographic segmentation used for business analysis and prospecting.
A city-level business dataset should not be assumed to be directly equivalent to a state-level GSTN statistical table unless the underlying source, coverage and methodology are explicitly comparable.
Key Data Limitation
The most important limitation of this research is that GST registration data is an indicator of formal tax registration activity, not a complete measure of economic or commercial activity.
GST registration data provides an indicator of formal tax registration activity. It should not be interpreted as a direct measure of active businesses, revenue, employment, or commercial viability unless supported by additional evidence.
A new GST taxpayer may subsequently become inactive, may represent a registration rather than a unique operating company, or may not represent a commercially attractive prospect.
Likewise, a high number of registrations in a state does not automatically mean that the state has the highest revenue opportunity for every B2B company.
The report therefore uses GST registration activity primarily as a market-intelligence signal.
2026 context versus FY 2023–24 detailed analysis
The latest national figures provide useful context for the continuing expansion of the GST taxpayer base. Government of India data states that GST taxpayers increased from 66.5 lakh in 2017 to 1.65 crore in May 2026, while a later government factsheet reports more than 1.68 crore as of 31 July 2026. Press Information Bureau
These figures should not be interpreted as 2026 new registrations.
The detailed state ranking in this report remains based on the FY 2023–24 new-taxpayer dataset, because that is the comparable state-level dataset available in the GSTN statistical report. GST Tutorial
This separation prevents the report from presenting different measures as though they were part of the same dataset.
7.3 Research Sources
The report uses primary government and GST-system sources wherever possible.
1. Goods and Services Tax Network (GSTN)
Dataset / Report: 7 Years of GST – A Statistical Report on Completion of 7 Years of GST
Period: Primarily FY 2023–24, with historical GST statistics
Publisher: Goods and Services Tax Network (GSTN)
Use in this report: State-wise new-taxpayer analysis, national new-taxpayer total and supporting GST statistics. GST Tutorial
2. GSTN Annual Report 2023–24
Dataset / Report: Annual Report of GSTN 2023–24
Period: FY 2023–24; registration statistics through August 2024
Publisher: Goods and Services Tax Network
Use in this report: GST registration context, active-taxpayer statistics and supporting methodological information. GSTN
3. GSTN Historical Taxpayer Statistics
Dataset / Publication: GSTN IITF Brochure – Growth in Taxpayer Base
Period: April 2018–October 2024
Publisher: Goods and Services Tax Network
Use in this report: Historical active-taxpayer series used to illustrate the expansion of the GST taxpayer base. GSTN
4. Government of India / Press Information Bureau
Publication: Nine Years of GST: Simplifying Taxation, Strengthening India
Period: Published June 2026; taxpayer position through May 2026
Publisher: Press Information Bureau, Government of India
Use in this report: Current national GST taxpayer-base context and formalisation narrative. Press Information Bureau
5. Government of India / PIB Research Factsheet
Publication: GST 2.0 / Economic and Formalisation Factsheet
Period: Taxpayer position as of 31 July 2026
Publisher: Press Information Bureau, Government of India
Use in this report: Latest national taxpayer-base context available for the October 2026 report. Press Information Bureau
Source-Note Standard Used Throughout the Report
To maintain transparency, major charts and tables should carry a source note directly beneath the visual, rather than requiring the reader to consult only this chapter.
The standard format is:
Source: Goods and Services Tax Network (GSTN), 7 Years of GST – A Statistical Report on Completion of 7 Years of GST.
Note: EMarket Zone calculations based on the published GSTN dataset.
For visuals using multiple sources:
Sources: GSTN; Government of India / Press Information Bureau.
Note: Figures shown for different periods are not directly comparable unless explicitly stated. EMarket Zone calculations where applicable.
This approach separates source data, EMarket Zone calculations, and EMarket Zone interpretation—which is essential for maintaining the credibility of a research-led report.
About EMarket Zone
EMarket Zone is a business-data and market-intelligence platform designed to help companies identify and reach relevant B2B markets across India. We bring together business data, geographic insights and market intelligence to help sales and marketing teams move from broad market research to more focused prospecting.
Our GST-focused business datasets can help businesses explore potential accounts across India, states, cities and business segments, supporting applications such as B2B lead generation, sales prospecting, market expansion and targeted marketing.
The objective is simple: make business markets easier to understand and easier to reach.
Business Data → Market Intelligence → B2B Lead Generation
Explore Business Data
Turn Market Intelligence Into Action
Identify the market. Find the businesses. Build your target universe. Start your next B2B campaign.
End of Report
EMarket Zone
Verified Data. Smarter Growth.
Copyright © 2026 EMarket Zone. All rights reserved.