
TABLE OF CONTENTS
Executive Summary
Research thesis, report scope, methodology and the key factors shaping India’s B2B market opportunity in 2026.
01 — India’s B2B Business Ecosystem
Overview of India’s business universe, formalization, enterprise structure and the foundations of the B2B economy.
02 — Geographic Concentration of India’s B2B Opportunity
State-level business concentration, regional differences and the geographic distribution of commercial activity.
03 — India’s B2B City Ecosystem
Major metropolitan markets, emerging business centres and the different commercial roles played by India’s leading cities.
04 — Industry-wise B2B Opportunity in India
Manufacturing, trading, services and emerging sectors, with a focus on industry ecosystems and B2B relevance.
05 — India’s B2B Activity & Industry Structure
Business activity patterns, sector composition and the relationship between industries, suppliers, buyers and supporting ecosystems.
06 — The Private Limited Company Opportunity
India’s corporate structure, private limited companies and the characteristics of the formal company universe relevant to B2B markets.
07 — B2B Company Segmentation
Company scale, business stage, complexity and the development of a structured B2B segmentation model.
08 — Identifying High-Opportunity B2B Markets
Market scale, industry relevance, company fit, ecosystem depth and accessibility as a framework for market prioritization.
09 — From Market Intelligence to B2B Lead Generation
Moving from market selection to target accounts, decision-makers, engagement, qualification and commercial opportunity.
10 — Data, Intelligence & the Future of B2B Market Development
Data quality, verification, enrichment, business signals, AI, governance and the transition from static data to market intelligence.
11 — Building a B2B Market Intelligence Strategy
A practical framework for defining objectives, building ICPs, prioritizing markets, selecting accounts and connecting intelligence with sales execution.
12 — Conclusion: From India’s Business Scale to Commercial Precision
Key findings, strategic implications and the transition from business data and market structure to actionable B2B opportunity.
Sources & References
Government, institutional, industry and research sources used throughout the report, with source dates and methodology notes where applicable.
About the Publisher
About EMarket Zone, its business intelligence research and its role in providing structured business data and market intelligence resources.
Executive Summary
India B2B Market Opportunity Report 2026
India’s B2B opportunity is no longer defined simply by the size of its business population.
The more important question is where commercially relevant businesses are concentrated, which industries create dense business ecosystems, how company characteristics influence addressability, and how these patterns can be translated into actionable market priorities.
India entered FY2026–27 with continued economic momentum. The World Bank estimates that the Indian economy grew by 7.6% in FY2025–26, while projecting 6.6% growth in FY2026–27 amid heightened external uncertainty. Its latest India Development Update also points to continued strength in domestic demand, manufacturing and services.
For B2B businesses, however, macroeconomic growth is only the starting point.
The commercial opportunity is distributed unevenly across states, cities, industries, business clusters and company segments. Understanding this distribution is essential for businesses deciding where to sell, which industries to prioritize, which accounts to target and how to allocate sales and marketing resources.
The central finding
India’s B2B opportunity is a concentration and prioritization problem before it is a lead-generation problem.
A business does not necessarily create better commercial opportunities by reaching more companies. It creates better opportunities by identifying the right companies, in the right markets, with the right business characteristics and, where possible, the right timing.
This report therefore moves beyond simply counting businesses. It examines the structure of India’s B2B ecosystem and develops a framework for moving from business presence to commercial opportunity.
What This Report Examines
The research evaluates India’s B2B opportunity through a series of interconnected dimensions:
01 – Business Ecosystem
Understanding the scale and composition of India’s registered business and MSME landscape.
02 – Geography
Identifying where business activity is concentrated across states, cities and commercial clusters.
03 – Industry
Examining the sectors and value chains that create significant B2B ecosystems.
04 – Company Structure & Segmentation
Understanding how legal structure, company scale, business stage and operating characteristics affect target-market selection.
05 – Market Opportunity
Developing a framework for identifying markets where scale, industry relevance, company fit, ecosystem depth and accessibility intersect.
06 – Commercial Intelligence
Connecting market analysis with account selection, decision-maker identification, outreach, qualification and sales execution.
07 – Intelligence Strategy
Showing how organizations can build a repeatable system that continuously converts market information into better commercial decisions.
This creates a progression from:
Business Landscape → Market Structure → Opportunity → Intelligence → Commercial Action
The report builds on the broader geographic and structural foundation established in EMarket Zone’s India Business Landscape Report 2026, but takes the analysis further by examining how the business landscape can be interpreted from a B2B market-development perspective.
Five Signals That Define India's B2B Opportunity
1. Economic momentum creates the underlying demand environment
India remains one of the world’s fastest-growing major economies.
The World Bank estimates 7.6% real GDP growth in FY2025–26 and projects 6.6% growth in FY2026–27. Its April 2026 assessment highlights domestic demand, manufacturing and services as important components of the current growth environment.
For B2B markets, the relevance extends beyond GDP itself.
Economic expansion can create additional demand for:
→ Technology
→ Equipment
→ Business services
→ Financial products
→ Logistics
→ Infrastructure
→ Professional services
→ Industrial inputs
→ Specialized suppliers
The macroeconomic environment therefore establishes the context in which B2B opportunity develops, but it does not by itself determine which markets are attractive.
2. India’s MSME ecosystem provides enormous business scale
The Ministry of MSME’s live dashboard recorded 9.28 crore Udyam and Udyam Assist Platform registrations as of 15 August 2026, comprising approximately 5.22 crore Udyam registrations and 4.06 crore Udyam Assist registrations.
The same dashboard records approximately:
→ 1.85 crore manufacturing registrations
→ 3.53 crore service registrations
→ 3.91 crore trading registrations
as of the same date.
These figures illustrate the scale and diversity of India’s formalisation ecosystem.
They should not, however, be interpreted as a count of unique companies or as a direct measure of B2B market revenue. Registration categories, definitions and the distinction between enterprises and registrations matter.
For this report, the significance is structural:
India contains a business universe large enough that segmentation and prioritization become essential to commercial decision-making.
The supporting State-wise MSME Statistics in India 2026 page provides a more detailed geographic reference.
3. Opportunity is geographically concentrated
India’s national business population masks substantial differences between regions.
Major commercial centres and industrial states have developed distinct economic profiles.
Examples include:
Maharashtra – finance, corporate services, manufacturing and diversified industry
Karnataka – technology, software and corporate services
Tamil Nadu – manufacturing, automotive, engineering and technology
Gujarat – manufacturing, chemicals, engineering and trading
Delhi NCR – corporate services, trade, technology and diversified business activity
Telangana – technology, pharmaceuticals and life sciences
These are not universal rankings.
They illustrate the central point of the geographic analysis:
A national B2B strategy can become inefficient when every geography is treated as if it has the same commercial structure.
The report therefore moves from state-level concentration to city and cluster-level opportunity, allowing businesses to examine where relevant ecosystems are actually located.
4. Industry concentration creates different types of B2B opportunity
Business activity is not commercially homogeneous.
Manufacturing creates extensive supplier and industrial ecosystems.
Trading creates distribution and channel networks.
Services create demand for technology, professional expertise and business infrastructure.
Healthcare and pharmaceuticals create specialized ecosystems.
Technology creates digitally scalable markets.
Logistics connects multiple industries.
Emerging technology and industrial sectors can create additional supplier networks as investment and adoption increase.
Consequently, the report does not treat “industry size” as synonymous with opportunity.
Instead, it examines the relationship between:
Industry
→ Geography
→ Company Profile
→ Business Ecosystem
This allows the analysis to distinguish between a large general market and a smaller but highly specialized market where customer fit may be substantially stronger.
The report’s industry analysis is supported by the broader India Business Statistics 2026 research resource.
5. Commercial opportunity emerges from prioritization
The central commercial implication of the research is that market selection should precede mass prospecting.
A B2B company should first determine:
Where is the relevant market?
↓
Which industries matter?
↓
Which company segments fit?
↓
Which businesses have the strongest potential need?
↓
Which accounts should receive priority?
↓
Who are the relevant decision-makers?
This creates a progression from market intelligence to account intelligence.
The report therefore treats lead generation as an outcome of good market selection rather than the starting point of the process.
From Business Count to Commercial Opportunity
One of the report’s most important distinctions is between business presence and B2B opportunity.
A market can contain a very large number of businesses while still being a poor market for a particular product.
Conversely, a smaller market can be highly attractive when it contains a dense concentration of businesses matching the company’s ideal customer profile.
The report therefore uses the following conceptual framework:
Business Density
↓
Industry Relevance
↓
Company-Profile Fit
↓
Market / Cluster Strength
↓
Business Need & Timing
↓
Commercial Opportunity
This is deliberately a framework rather than an artificial market score.
The report does not claim that one city, state or industry has an objectively superior “opportunity score” without a transparent methodology capable of measuring all relevant variables consistently.
Instead, it identifies the factors that should be considered when prioritizing markets.
The B2B Opportunity Model
Across the report, five core dimensions repeatedly emerge:
Market Scale
How large is the relevant business universe?
Industry Relevance
How closely does the market’s dominant activity match the product or service?
Company-Profile Fit
Do the businesses operating there match the intended customer profile?
Ecosystem Depth
Are there suppliers, buyers, distributors and complementary businesses that strengthen the market?
Market Accessibility
Can the organization reach and serve the market efficiently?
Together, these dimensions provide a more defensible basis for market prioritization than business counts alone.
From Market Intelligence to Revenue
The report ultimately follows a clear commercial progression:
Business Universe
↓
Addressable Market
↓
Target Accounts
↓
Decision-Makers
↓
Engagement
↓
Qualified Opportunities
↓
Revenue
This is the bridge between research and execution.
The first question is:
Where is the opportunity?
The next is:
Which companies represent it?
And finally:
How should the organization act on it?
What the Research Means for B2B Decision-Makers
Sales Teams
Use geographic, industry and company segmentation to prioritize territories and accounts before allocating prospecting resources.
Marketing Teams
Build campaigns around specific industry–geography–company combinations rather than relying exclusively on broad national targeting.
Manufacturers & Distributors
Identify regional ecosystems where suppliers, distributors, manufacturers and commercial buyers are concentrated.
Technology Companies
Identify industries and business hubs where the customer profile matches the requirements of a specific technology solution.
Professional & Business Services
Identify company segments where organizational complexity, growth or expansion creates recurring demand for specialized services.
Researchers & Investors
Use geographic and industry concentration to understand regional specialization, business ecosystems and emerging commercial markets.
From Market Intelligence to Account Intelligence
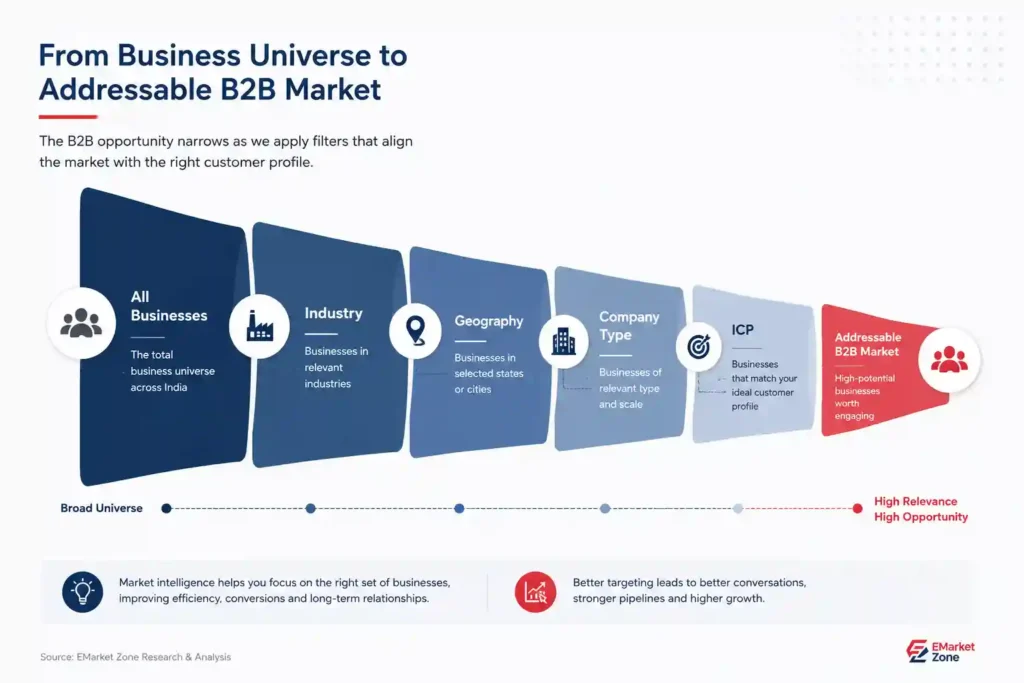
The report’s analytical framework ultimately narrows the market through successive filters:
India Business Universe
↓
Priority Geography
↓
Relevant Industry
↓
Company Type
↓
Company Scale
↓
Business Stage
↓
Need / Intent
↓
Priority Account
The market becomes progressively smaller at each stage.
That is intentional.
The objective is not to maximize the number of businesses in the final target universe.
It is to maximize the commercial relevance of that universe.
The Role of Data and Intelligence
This distinction becomes increasingly important as India’s business universe expands.
A basic business record provides information.
Structured data provides segmentation.
Business signals provide context.
Market intelligence provides interpretation.
The progression is:
Data
→ Verification
→ Classification
→ Enrichment
→ Business Signals
→ Market Intelligence
→ Commercial Decisions
This is the focus of Section 10.
The report therefore treats data quality, freshness, governance and responsible use as foundational requirements rather than secondary technical considerations.
From Intelligence to a Repeatable B2B Strategy
The final sections move from analysis to implementation.
The report develops a practical operating model:
Define Objective
→ Build ICP
→ Prioritize Markets
→ Select Accounts
→ Identify Decision-Makers
→ Activate Outreach
→ Measure Results
→ Refine Intelligence
The process then repeats.
This creates a continuous cycle:
Research → Action → Learning → Refinement
The objective is not to produce a one-time market map.
It is to establish a repeatable intelligence process that improves as new market and sales information becomes available.
Research Scope & Methodology
This report focuses on the structure and distribution of India’s B2B opportunity in 2026.
It combines:
→ Government data
→ Institutional research
→ Economic and industry reports
→ Corporate and regulatory information
→ Geographic business analysis
→ Structured B2B market-intelligence frameworks
Official statistics are used wherever available for foundational measurements.
Commercial frameworks and interpretations are presented separately from official statistics and should not be interpreted as government estimates.
The report also deliberately avoids producing a single monetary estimate for India’s entire B2B market.
Such an estimate would require comprehensive transaction, expenditure and industry-level revenue data across a highly fragmented economy and could create a false appearance of precision.
Instead, the research asks a more actionable question:
Where are the businesses, industries, company segments and ecosystems that create identifiable B2B opportunities—and how can those opportunities be prioritized?
Research Note
Business registrations, classifications and market conditions change continuously.
Accordingly, figures in this report should always be interpreted alongside their source, date and definition.
For example, the Ministry of MSME dashboard’s 9.28 crore figure represents Udyam and Udyam Assist Platform registrations, not a simple count of unique operating companies.
Similarly, macroeconomic growth figures represent national economic activity and should not be interpreted as direct measures of B2B market size. The World Bank’s 7.6% FY2025–26 growth estimate provides economic context, not a direct estimate of B2B demand.
This distinction is important to maintaining the report’s research integrity.
Sources & Further Reading
→ World Bank — India Development Update, April 2026
→ World Bank — India Economic Outlook, April 2026
→ Ministry of MSME — Performance Dashboard
→ Ministry of MSME — Government of India
→ Ministry of Corporate Affairs — Government of India
→ EMarket Zone — India Business Landscape Report 2026
Chapter 1 (Understanding India's B2B Market)
Introduction
India’s business economy is too diverse to be understood through a single measure such as the number of registered enterprises. For B2B companies, the more relevant question is how this business population is structured: which types of organizations operate in the market, what they purchase and supply, where they are concentrated, and how they interact within broader commercial ecosystems.
The B2B market includes transactions in which businesses purchase products or services from other businesses rather than from individual consumers. This encompasses everything from industrial machinery and raw materials to software, logistics, professional services, financial solutions and specialized business support.
This distinction is important because the characteristics that make a market attractive to a consumer-facing company are not necessarily the characteristics that make it attractive to a B2B company.
1.1 What Constitutes India's B2B Market?
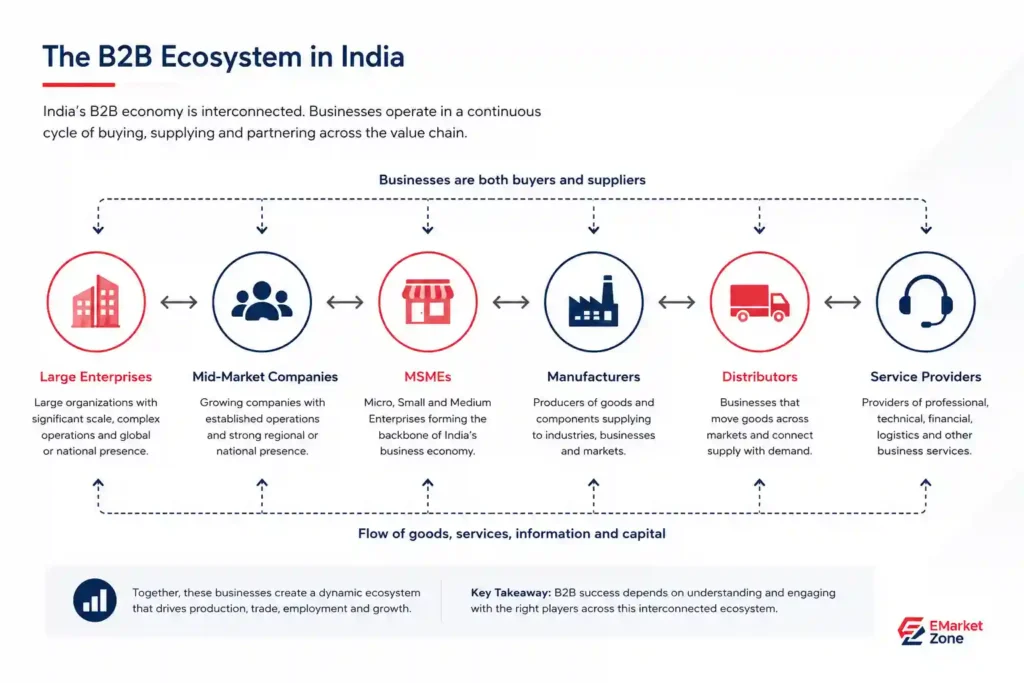
India’s B2B economy extends across virtually every major part of the productive economy.
At one end are large enterprises and industrial companies purchasing equipment, technology, components, professional services and other inputs at significant scale. At the other are micro and small enterprises purchasing inventory, raw materials, services, technology and distribution support to operate their businesses.
Between these groups is a large network of:
• Manufacturers
• Wholesalers
• Distributors
• Importers and exporters
• Contractors
• Service providers
• Technology companies
• Professional firms
• Logistics businesses
• Financial-service providers
• Healthcare businesses
• Industrial suppliers
These businesses are not isolated entities. They form interconnected supply chains, commercial clusters and local business ecosystems.
For example, an automobile manufacturing cluster does not consist only of vehicle manufacturers. It can include component manufacturers, machinery suppliers, logistics companies, maintenance providers, technology firms, packaging businesses, financial services and other specialized suppliers.
This interconnected structure is one of the defining characteristics of B2B markets.
1.2 The Business Ecosystem Is More Important Than the Business Count
A simple business count answers one question:
How many businesses exist?
B2B market analysis needs to answer several additional questions:
Where are they located?
What industries do they operate in?
What type of companies are they?
How closely are related businesses clustered together?
Which of these businesses are commercially relevant to a particular product or service?
This distinction changes how market opportunity should be evaluated.
A state may have a very large number of registered businesses but still be a relatively weak market for a particular B2B product if the relevant industry is underrepresented. Conversely, a smaller geographic market can become highly attractive when it contains a dense concentration of companies from a target industry.
The implication is that business volume and market opportunity are related, but they are not synonymous.
1.3 India's Formal Business Structure
India’s business ecosystem contains multiple organizational forms, each with different characteristics and implications for B2B activity.
The Ministry of Corporate Affairs (MCA) maintains India’s corporate registry and provides information relating to companies and limited liability partnerships through its corporate information systems. This formal corporate layer is particularly relevant when analysing India’s organized business sector. Ministry of Corporate Affairs – Government of India
Alongside incorporated companies, India’s economy contains a much broader MSME ecosystem. The Ministry of Micro, Small & Medium Enterprises recognizes micro, small and medium enterprises as a major component of India’s economic structure and maintains official information and reporting on the sector. Ministry of MSME – Government of India
These structures should not be treated as interchangeable.
A private limited company, a partnership, a proprietorship and an MSME classification answer different questions about a business. Legal structure describes how an organization is constituted; MSME classification describes its position within the MSME framework.
That distinction becomes important later in this report when we assess target-company segments.
1.4 MSMEs: The Broadest B2B Opportunity Layer
MSMEs represent one of the most important layers of India’s domestic business ecosystem.
Their importance to B2B markets comes not only from their aggregate number but from their position within commercial networks. MSMEs can simultaneously act as:
Buyers → Suppliers → Manufacturers → Distributors → Service Providers → Channel Partners
A small manufacturing business may purchase raw materials from another company, sell components to a larger manufacturer, use accounting or software services from another provider, and distribute its products through wholesalers.
This creates a multi-directional B2B ecosystem, rather than a simple buyer-seller relationship.
The official Udyam Registration system has also created a more structured mechanism for the formal registration of MSMEs. The Government’s Udyam portal provides information on registration and the formal MSME ecosystem. Udyam Registration – Government of India
This increasing formalization is relevant to market intelligence because more structured business information can make it easier to identify, classify and segment potential business markets.
For a deeper examination of India’s MSME distribution, readers can also refer to EMarket Zone’s India Business Landscape Report 2026, which provides the broader business-landscape context on which this report builds.
1.5 B2B Markets Are Built Around Business Relationships
Consumer markets are generally organized around individual demand.
B2B markets are organized around business relationships and operational requirements.
A company may purchase because it needs:
• Production inputs
• Inventory
• Machinery
• Transportation
• Technology
• Financial services
• Marketing services
• Recruitment
• Consulting
• Maintenance
• Compliance support
• Distribution
• Specialized expertise
Consequently, B2B opportunity often emerges where businesses are dependent on other businesses to operate or expand.
This is why industrial clusters and commercial hubs can become disproportionately valuable.
The presence of one major industry can generate demand for dozens of supporting industries around it. Over time, these relationships can produce specialized ecosystems that are considerably more commercially relevant than a simple count of businesses would suggest.
1.6 Geography Changes the B2B Opportunity
India’s size makes geography a fundamental component of B2B market analysis.
Business activity is not evenly distributed across the country. Different states and cities have developed distinctive economic profiles based on factors including infrastructure, industrial history, access to markets, skilled labour, logistics, investment, technology ecosystems and proximity to supply chains.
For example, Bengaluru’s technology ecosystem, Mumbai’s financial and corporate economy, Gujarat’s industrial base, Tamil Nadu’s manufacturing network, and Delhi NCR’s broad corporate and services ecosystem represent materially different B2B environments.
The opportunity for a particular B2B company therefore depends partly on market–product fit at a geographic level.
A logistics provider, industrial-equipment supplier, HR technology company and pharmaceutical distributor may each produce very different geographic opportunity maps.
This is why the next stage of this report examines the distribution of B2B businesses across Indian states and regional markets, rather than treating India as a single market.
1.7 A Framework for Measuring B2B Opportunity
For this report, B2B opportunity is considered through five connected dimensions:
| Dimension | Core question |
|---|---|
| Business Density | How many relevant businesses are present? |
| Industry Concentration | How strongly is the target industry represented? |
| Company Profile | What types and sizes of businesses operate there? |
| Market Connectivity | How developed are the surrounding supplier, buyer and service ecosystems? |
| Commercial Fit | How closely does the market match the target product or service? |
No single dimension is sufficient on its own.
A market with high business density but low industry relevance may be less attractive than a smaller market with a highly concentrated target industry.
Likewise, a market with strong industry concentration but limited company diversity may offer a specialized opportunity rather than a broad B2B market.
This framework will be used throughout the report to move from business presence to commercially meaningful opportunity.
Key Takeaways(Why Market Intelligence Matters)
The increasing complexity of India’s business ecosystem makes broad-based prospecting increasingly inefficient.
A national campaign that treats every company as an equivalent prospect can generate large volumes of leads while producing relatively little commercial value.
Market intelligence provides a different approach.
Instead of asking:
“How can we reach more businesses?”
B2B organizations can ask:
“Which businesses should we reach first?”
That shift has implications across the entire commercial process—from territory planning and account selection to lead generation, sales outreach and customer acquisition.
The following sections therefore examine the Indian B2B market through geography, cities, industries and company segments, progressively narrowing the business universe toward identifiable commercial opportunities.
Chapter 2 (Geographic Concentration of India's B2B Opportunity)
Introduction
India is a national market, but it is not a geographically uniform B2B market.
Businesses are concentrated across a relatively small number of states, while individual regions have developed distinct commercial, industrial and service ecosystems. For B2B companies, this concentration matters because the location of potential customers can influence distribution costs, sales efficiency, partner availability, competition and the economics of market expansion.
The latest state-wise data from the Ministry of Micro, Small & Medium Enterprises (MSME) provides a useful starting point. As of the latest dashboard data available for this report, India had more than 5.24 crore enterprises registered on the Udyam system, excluding enterprises recorded through the separate Udyam Assist/IME category.
However, the national total tells only part of the story. The distribution across states is considerably more concentrated.
2.1 A Highly Concentrated Business Geography
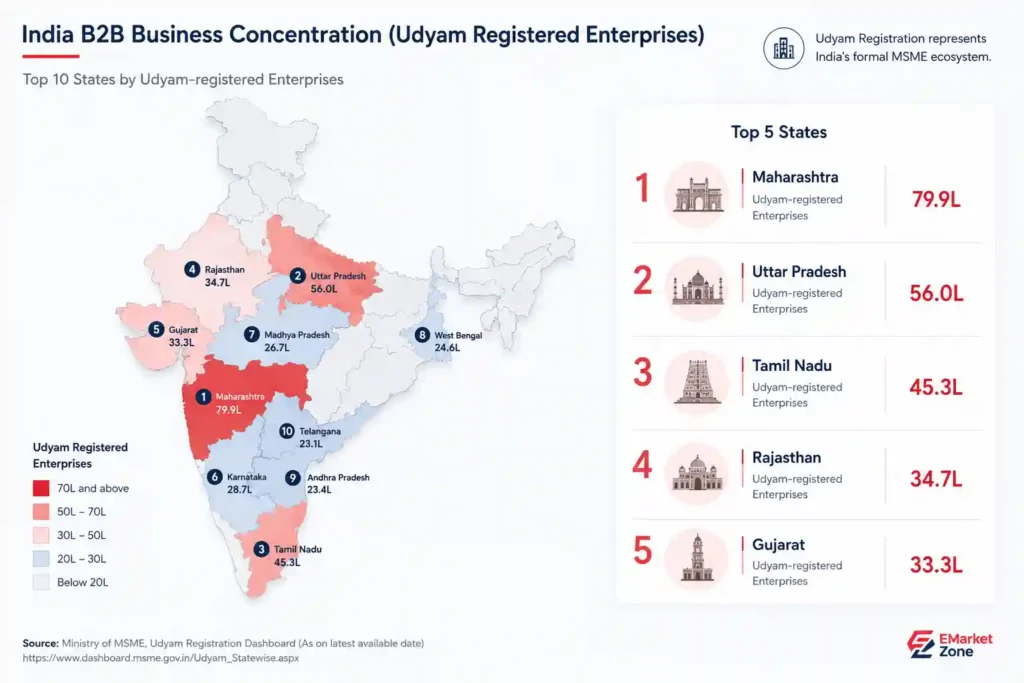
The latest Ministry of MSME state-wise data shows substantial differences in the number of Udyam-registered enterprises across states.
Maharashtra leads the country with approximately 79.9 lakh Udyam-registered enterprises, followed by Uttar Pradesh with approximately 56.0 lakh and Tamil Nadu with approximately 45.3 lakh. Rajasthan, Gujarat and Karnataka form the next major group, each with more than 28 lakh registered enterprises.
Top States by Udyam-Registered Enterprises
| Rank | State | Udyam-registered enterprises |
|---|---|---|
| 1 | Maharashtra | 79.9 lakh |
| 2 | Uttar Pradesh | 56.0 lakh |
| 3 | Tamil Nadu | 45.3 lakh |
| 4 | Rajasthan | 34.7 lakh |
| 5 | Gujarat | 33.3 lakh |
| 6 | Karnataka | 28.7 lakh |
| 7 | Madhya Pradesh | 26.7 lakh |
| 8 | West Bengal | 24.6 lakh |
| 9 | Andhra Pradesh | 23.4 lakh |
| 10 | Telangana | 23.1 lakh |
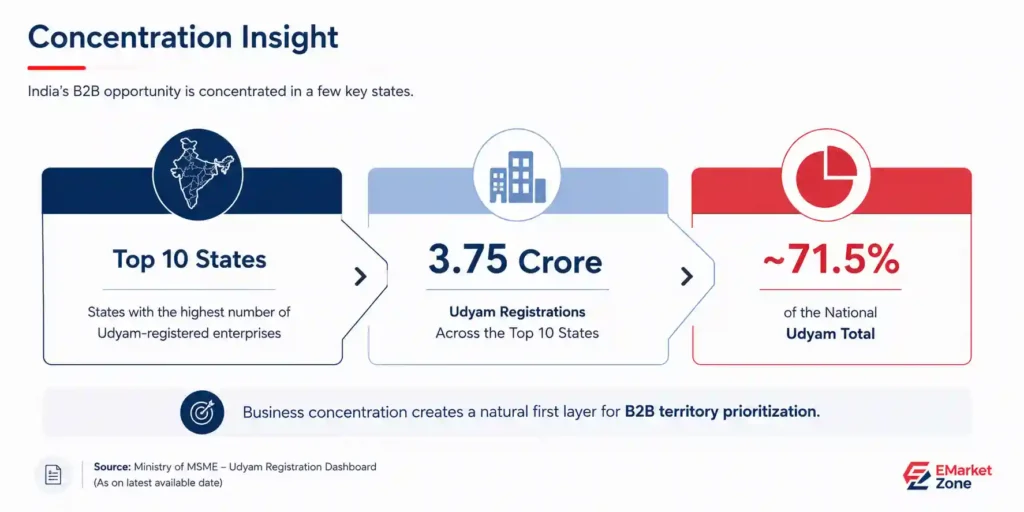
These ten states together account for approximately 3.75 crore Udyam registrations, or roughly 71.5% of the national Udyam total.
This is an important finding for B2B market planning.
It indicates that a significant share of India’s registered MSME business universe is concentrated within a relatively limited set of geographic markets. A company attempting nationwide expansion does not necessarily need to treat all states as equally important at the initial stage.
2.2 Maharashtra: India's Largest Registered MSME Market
Maharashtra occupies a distinctive position in India’s business geography.
The state has approximately 79.9 lakh Udyam-registered enterprises, the highest figure among Indian states in the latest available dashboard data.
Its importance extends beyond business volume. Maharashtra contains several major economic centres and industry ecosystems, including Mumbai and Pune, alongside substantial manufacturing, financial services, technology, logistics, trading and professional-services activity.
For B2B companies, this creates multiple potential customer environments within a single state.
A financial-services provider, industrial supplier and enterprise technology company may all find Maharashtra attractive, but for very different reasons.
The implication is important:
A state-level opportunity should not be interpreted as a single homogeneous market.
Maharashtra’s scale makes it a high-priority geography, but the next layer of analysis must examine its cities, industries and company profiles.
2.3 Uttar Pradesh: Scale Beyond the Traditional Corporate Hubs
Uttar Pradesh ranks second by Udyam registrations, with approximately 56.0 lakh registered enterprises in the latest available data.
Its scale is particularly significant because it demonstrates that major B2B opportunity is not restricted to India’s traditional metropolitan corporate centres.
The state contains a diverse business base spanning manufacturing, trading, services, food processing, textiles, engineering, construction and other activities.
Its geographic size also means that opportunity is distributed across multiple urban and industrial centres rather than concentrated in one city.
For B2B market expansion, Uttar Pradesh therefore represents a different proposition from Maharashtra: high aggregate business volume combined with a more distributed geographic structure.
2.4 Southern India Forms a Major B2B Cluster
Tamil Nadu, Karnataka, Andhra Pradesh and Telangana together represent a major component of India’s registered enterprise ecosystem.
Tamil Nadu alone has approximately 45.3 lakh Udyam-registered enterprises, while Karnataka has approximately 28.7 lakh. Andhra Pradesh and Telangana add another 23.4 lakh and 23.1 lakh, respectively.
The significance of this concentration goes beyond enterprise counts.
Southern India contains several highly developed industry and service ecosystems, including:
• Automotive and engineering
• Electronics and technology
• IT and business services
• Pharmaceuticals
• Textiles and apparel
• Manufacturing
• Logistics
• Export-oriented industries
This creates opportunities for B2B businesses that sell into industry clusters rather than generic geographic markets.
For example, a technology provider targeting manufacturers may have a very different opportunity map from a financial-services company targeting professional firms.
The same geography can therefore produce multiple distinct B2B markets depending on the target industry.
2.5 Western India Combines Business Scale With Industrial Density
Gujarat and Maharashtra form another important B2B corridor.
Gujarat has approximately 33.3 lakh Udyam-registered enterprises, while Maharashtra has approximately 79.9 lakh.
The western business ecosystem is particularly relevant to manufacturing, chemicals, engineering, pharmaceuticals, textiles, trading, logistics and export-oriented businesses.
Gujarat’s business landscape is also notable because its opportunity is not limited to Ahmedabad. Industrial and commercial activity extends across several cities and specialized clusters.
This illustrates why city-level and industry-level analysis must complement state-level rankings.
A state with a large number of businesses can contain several very different commercial ecosystems.
2.6 Business Concentration Does Not Equal Commercial Opportunity
A high number of businesses is a strong indicator of market scale, but it should not automatically be interpreted as a ranking of the “best” B2B markets.
Consider two hypothetical markets:
Market A
• 1 million businesses
• Highly fragmented
• Low concentration of the target industry
• Limited presence of target company types
Market B
• 300,000 businesses
• High concentration of the target industry
• Strong supplier ecosystem
• High presence of relevant company types
For a specialized B2B product, Market B could be substantially more attractive despite having fewer businesses.
Therefore, the state ranking presented in this section should be interpreted as a measure of business-market scale, not a universal ranking of commercial attractiveness.
The later sections of this report introduce additional filters-industry, company type and market characteristics-to identify more specific opportunity segments.
2.7 The Geography of Opportunity Is Becoming More Layered
India’s B2B landscape can broadly be understood through several geographic layers.
National business centres
These markets combine substantial business volume with broad sector diversity.
Examples include Mumbai, Delhi NCR, Bengaluru, Chennai, Hyderabad, Pune and Ahmedabad.
Industrial ecosystems
These markets are more strongly associated with specific manufacturing or industrial activities.
Examples include Surat, Vadodara, Rajkot, Coimbatore, Tiruppur and Aurangabad/Chhatrapati Sambhajinagar.
Regional commercial centres
These cities serve large surrounding markets and can provide access to regional businesses without the cost structure or competition of the largest metros.
Emerging B2B markets
These are locations where business activity, infrastructure, industrial investment or specific sector ecosystems are creating new commercial potential.
This layered structure is important because the most attractive market for a B2B company may not always be India’s largest city.
2.8 Why State-Level Data Is Only the First Filter
A state ranking provides the first geographical screen.
A practical B2B market-selection process can then narrow the opportunity:
India
↓
State
↓
City / Business Cluster
↓
Industry
↓
Company Type
↓
Ideal Customer Profile
This approach prevents a common mistake in B2B expansion: selecting an entire state because its overall business population is large without determining whether the right businesses are actually concentrated there.
The next section therefore moves from state-level concentration to the city-level geography of B2B opportunity.
For readers looking for a broader view of India’s business distribution, the India Business Landscape Report 2026 provides the foundational national context, while the upcoming B2B Businesses by State in India – 2026 statistics page will provide a more detailed state-by-state reference dataset.
Key Insights
01 – Business activity is highly concentrated.
The ten largest states by Udyam registrations account for approximately 71.5% of the latest national Udyam total.
02 – Maharashtra is the largest registered MSME market.
Its approximately 79.9 lakh Udyam registrations place it clearly ahead of other states.
03 – Opportunity extends well beyond traditional metros.
Uttar Pradesh, Rajasthan, Madhya Pradesh and other large states demonstrate the scale of regional business markets.
04 – Southern and western India contain major business ecosystems.
Tamil Nadu, Karnataka, Telangana, Gujarat and Maharashtra combine substantial business populations with diverse industry clusters.
05 – Business count is a starting point, not the final opportunity measure.
Industry, company type, city and market fit must be layered onto geographic data before making commercial decisions.
Chapter 3 (India's Leading B2B Business Cities)
Introduction
State-level concentration establishes where India’s business activity is located. The next layer is more commercially important: which cities and metropolitan regions concentrate the businesses, industries, talent, infrastructure and commercial relationships that make a B2B market function?
India’s major business cities do not perform the same economic role. Bengaluru is strongly associated with technology and Global Capability Centres (GCCs), Mumbai with financial and corporate activity, Chennai and Pune with manufacturing and engineering, Hyderabad with technology and life sciences, and Delhi NCR with a broad combination of corporate, government, services and industrial activity.
This specialization means that a city should not be evaluated solely by the number of businesses located within its administrative boundaries. The relevant unit for B2B market analysis is often the wider economic cluster surrounding the city.
The Government of India’s Economic Survey has similarly emphasized the role of urban agglomeration and economic clustering, noting that modern services, advanced manufacturing and knowledge-intensive activities are disproportionately urban.
3.1 India's B2B Opportunity Is Increasingly Metropolitan
The concentration of business activity in India’s major metropolitan markets is visible across several indicators.
India’s leading office markets provide one useful proxy for corporate and service-sector concentration. In Q1 2026, Bengaluru, Mumbai and Delhi NCR together accounted for more than 60% of India’s gross office leasing activity, according to data reported by IBEF from the commercial real-estate market.
Across the broader market, Bengaluru, Delhi NCR, Mumbai, Hyderabad, Pune and Chennai continue to dominate major corporate-office activity. IBEF’s reporting on 2026 office-market performance identifies these cities as important centres for GCCs, multinational companies, technology businesses and large Indian enterprises.
This matters for B2B businesses because corporate concentration creates secondary demand.
A growing corporate cluster requires:
• Technology providers
• Professional services
• Recruitment and HR services
• Financial services
• Real-estate services
• Logistics
• Office infrastructure
• Security and facility management
• Marketing and communications
• Industrial and commercial suppliers
The city therefore becomes more than a collection of companies. It becomes an interconnected commercial ecosystem.
3.2 The Six Major B2B City Clusters
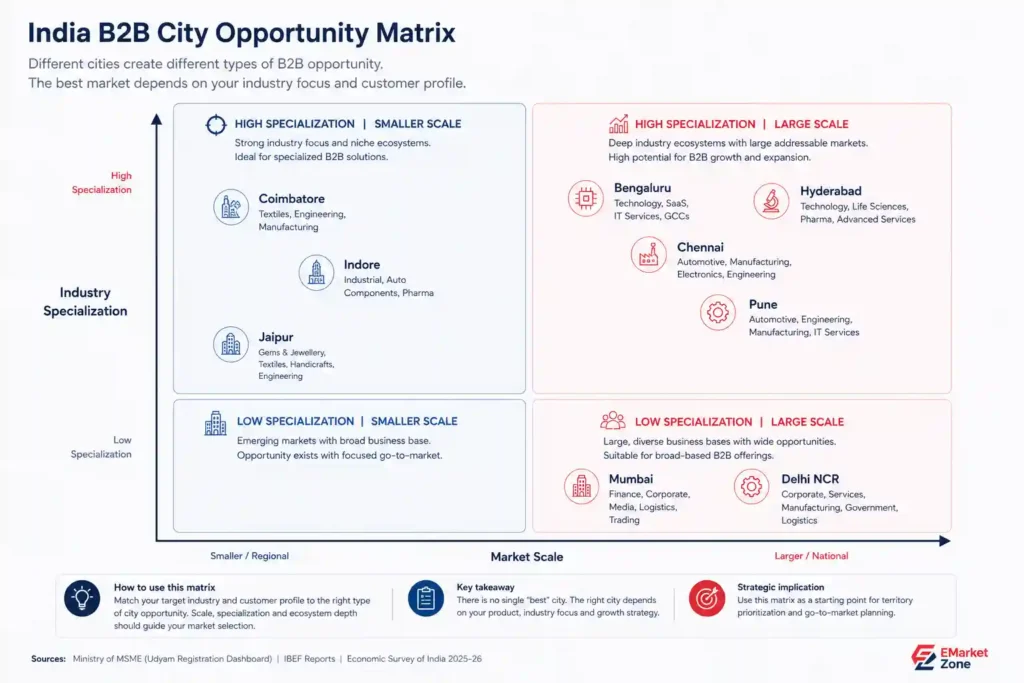
For this report, six metropolitan markets provide a useful first layer for understanding India’s national B2B geography:
| B2B cluster | Principal commercial strengths |
|---|---|
| Mumbai Metropolitan Region | Finance, corporate services, media, trading, manufacturing, logistics |
| Delhi NCR | Corporate services, technology, government-linked activity, trading, manufacturing, logistics |
| Bengaluru | Technology, SaaS, IT services, GCCs, electronics, engineering |
| Chennai | Automotive, manufacturing, engineering, technology, logistics |
| Hyderabad | Technology, pharmaceuticals, life sciences, GCCs, advanced services |
| Pune | Automotive, engineering, manufacturing, technology, professional services |
These should not be interpreted as six universally superior markets. They represent large, diversified B2B ecosystems in which multiple industries and company types coexist.
The commercial value of each market depends on the product or service being sold.
3.3 Bengaluru: India's Technology-Led B2B Ecosystem
Bengaluru occupies a distinctive position in India’s B2B landscape because of the depth of its technology ecosystem.
The city has developed a dense network of:
• IT services companies
• SaaS businesses
• Technology startups
• Global Capability Centres
• Electronics companies
• Engineering firms
• Consulting organizations
• Venture-backed businesses
• Enterprise technology buyers
The Global Capability Centre ecosystem illustrates this concentration. Bengaluru accounted for 36% of India’s GCC workforce in H1 2025, according to industry data reported by IBEF, making it the country’s largest GCC hub.
The opportunity therefore extends well beyond technology vendors selling to technology companies.
A large technology ecosystem creates demand for legal, accounting, recruitment, cybersecurity, cloud infrastructure, office services, consulting, financial products and specialized professional services.
For B2B companies with technology-oriented products, Bengaluru is therefore both a direct customer market and an ecosystem market.
3.4 Mumbai: Corporate, Financial and Commercial Scale
Mumbai represents a fundamentally different B2B environment.
Its importance is linked to financial services, corporate headquarters, capital markets, professional services, media, trading, logistics and a large surrounding industrial and commercial ecosystem.
The Mumbai Metropolitan Region also connects corporate demand with manufacturing, warehousing, transportation and distribution markets across Maharashtra.
The scale of the market is visible in commercial real estate as well. Mumbai remains one of India’s leading office markets and one of the country’s most expensive major business locations, alongside Delhi NCR.
For B2B companies, Mumbai can therefore be particularly relevant when the target market includes:
• Financial institutions
• Corporate enterprises
• Professional-services firms
• Large distributors
• Importers and exporters
• Media businesses
• Technology companies
• Corporate decision-makers
Its opportunity is less about one dominant industry and more about breadth, corporate density and commercial connectivity.
3.5 Delhi NCR: A Multi-City Commercial Ecosystem
Delhi NCR should not be treated simply as Delhi.
The National Capital Region spans multiple urban centres, including Gurugram, Noida, Ghaziabad, Faridabad and Delhi, creating a broader economic geography than any individual municipal boundary captures.
This distinction is particularly important for B2B prospecting.
A company targeting Delhi NCR may find its relevant customers distributed across different parts of the region:
Delhi → corporate and institutional activity
Gurugram → corporate headquarters, technology, consulting and services
Noida → technology, electronics, manufacturing and services
Faridabad → engineering and manufacturing
Ghaziabad → manufacturing, trading and industrial activity
The result is a highly diversified regional B2B ecosystem.
The Government’s Economic Survey identifies Delhi among India’s major urban agglomerations, while current market data continues to place Delhi NCR among India’s leading corporate and office markets.
For B2B sales teams, this makes NCR-level segmentation more useful than treating Delhi as an isolated city.
3.6 Chennai: Manufacturing Meets Technology
Chennai represents one of India’s strongest examples of a city where industrial and technology ecosystems overlap.
The wider Chennai region has major automotive, engineering, manufacturing and electronics activity, while its technology and services sector has developed alongside the industrial base.
This creates a particularly interesting B2B environment because companies can sell into both:
Industrial demand
and
Technology/service demand
The city is also a significant corporate and GCC location. Industry data shows Chennai among the major Indian markets for GCC and office activity, alongside Bengaluru, Hyderabad, Mumbai, Pune and Delhi NCR.
For industrial suppliers, technology providers, logistics companies and professional services firms, this combination creates multiple overlapping addressable markets.
3.7 Hyderabad: Technology, Life Sciences and Advanced Services
Hyderabad has developed into one of India’s major technology and corporate-service centres while maintaining a strong position in pharmaceuticals and life sciences.
The city’s B2B ecosystem therefore spans several categories:
• Information technology
• Cloud and cybersecurity
• Global Capability Centres
• Pharmaceuticals
• Biotechnology
• Healthcare
• Professional services
• Engineering
• Commercial real estate
Hyderabad accounted for approximately 14% of GCC clientele in the industry data reported by IBEF, with particular relevance to cloud computing, AI and cybersecurity.
The city’s technology concentration is also reinforced by continued investment in digital infrastructure. Current industry reporting places Hyderabad among India’s major data-centre markets alongside Mumbai, Chennai, Bengaluru and Delhi NCR.
This creates a useful example of sector diversification within a city: technology growth can reinforce demand in infrastructure, professional services and specialized business supply chains.
3.8 Pune: The Industrial–Technology Bridge
Pune occupies an important position between India’s traditional industrial economy and its newer technology economy.
The city and surrounding region have strong connections to:
• Automotive
• Engineering
• Industrial manufacturing
• Electrical equipment
• Chemicals
• Information technology
• Professional services
The Government’s Principal Scientific Adviser material identifies Pune among India’s Tier-1 technology and industrial locations, with automotive, industrial, electrical and chemical activity forming important focus areas.
Pune’s commercial structure makes it particularly relevant for B2B businesses that need access to both industrial companies and technology/service organizations.
This hybrid structure is commercially valuable because suppliers can potentially serve multiple customer segments from the same geographic base.
3.9 The B2B City Opportunity Is Not Limited to Tier-1 Markets
The concentration of large enterprises in India’s major metros should not be mistaken for the absence of opportunity elsewhere.
A second layer of cities is increasingly relevant because of:
• Lower operating costs
• Manufacturing specialization
• Regional demand
• Industrial corridors
• Improved connectivity
• Technology adoption
• Expansion of corporate services
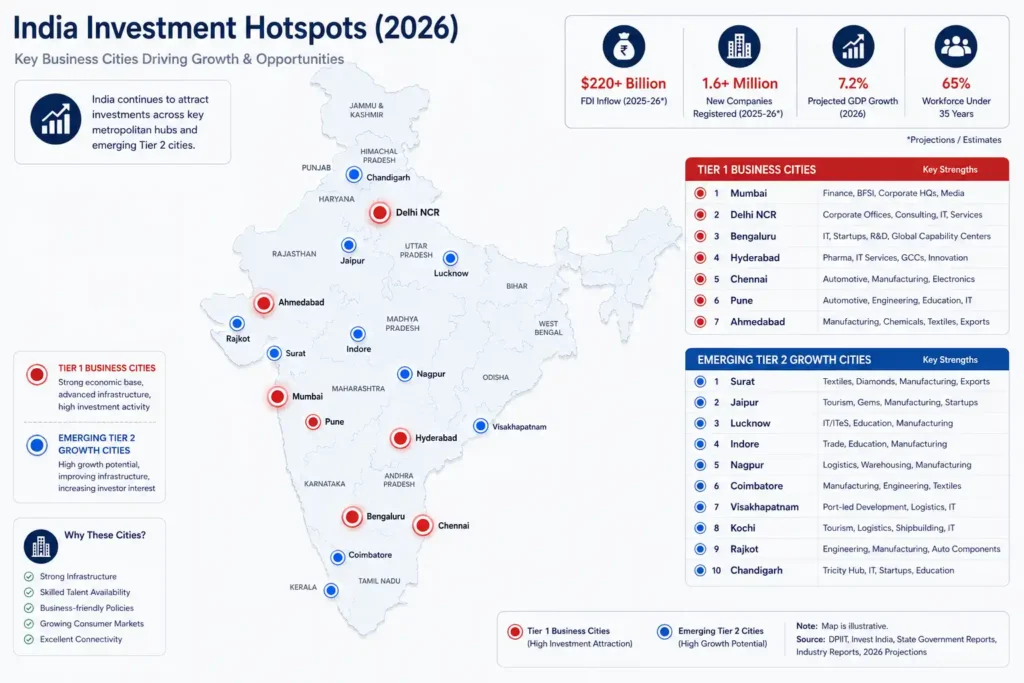
Recent research on India’s GCC ecosystem illustrates this shift. While major Tier-1 cities currently house the overwhelming majority of GCCs, cities including Jaipur, Bhubaneswar, Indore, Coimbatore and Visakhapatnam are increasingly being considered for future GCC expansion.
This creates an important distinction:
Tier-1 cities provide scale and diversification; emerging cities can provide specialization, lower competition and regional access.
For B2B expansion, both can be valuable-but for different strategic reasons.
3.10 City Selection Should Follow Customer–Market Fit
A common mistake in B2B expansion is assuming that the largest city automatically represents the best market.
It does not.
The appropriate city depends on the customer’s industry and purchasing behaviour.
For example:
| Product / Service | Potentially relevant city characteristics |
|---|---|
| Enterprise SaaS | Technology and corporate clusters |
| Industrial machinery | Manufacturing centres |
| Automotive components | Automotive clusters |
| Financial services | Corporate and financial centres |
| Logistics | Manufacturing, trading and distribution hubs |
| HR / recruitment | Corporate and technology clusters |
| Industrial raw materials | Manufacturing ecosystems |
| Healthcare technology | Healthcare and life-sciences clusters |
This is why city selection should follow the same narrowing logic introduced earlier:
India → State → City/Cluster → Industry → Company Type → ICP
The city is therefore an intermediate market-selection layer, not the final answer.
Key Takeaways
01 – India’s major B2B markets are metropolitan ecosystems, not isolated municipal areas.
02 – Bengaluru, Mumbai, Delhi NCR, Chennai, Hyderabad and Pune represent six particularly important diversified B2B ecosystems. Current office-market and GCC data consistently identifies these markets among India’s leading corporate hubs.
03 – Each major city has a different commercial identity. Technology, finance, manufacturing, life sciences and corporate services are distributed unevenly.
04 – Tier-2 and specialized cities should not be ignored. Emerging GCC and industrial activity is expanding the addressable geography beyond the traditional metros.
05 – City selection should follow industry and ICP fit. The largest market is not automatically the most attractive market for every B2B company.
Chapter 4 (Industry-wise B2B Opportunity in India)
Introduction
Geography identifies where businesses are concentrated. Industry analysis determines what those businesses do—and therefore what kinds of products, services, suppliers and commercial relationships are likely to exist within each market.
This distinction is critical for B2B strategy. A database of businesses becomes commercially useful only when businesses can be segmented according to their economic activity, purchasing requirements and role within a value chain.
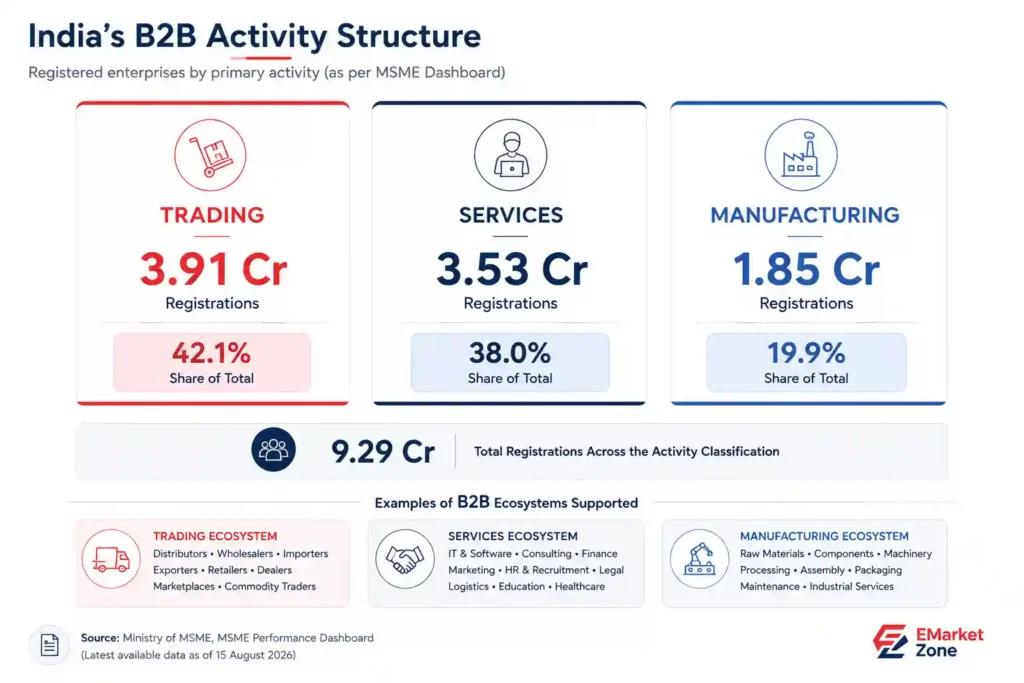
India’s B2B economy is not dominated by a single sector. It spans manufacturing, trading, services, construction, technology, healthcare, logistics, financial services and a growing group of technology-intensive industries. The latest Ministry of MSME dashboard illustrates this breadth: as of 15 August 2026, the MSME registration ecosystem including Udyam and Udyam Assist Platform recorded approximately 3.91 crore trading, 3.53 crore service and 1.85 crore manufacturing registrations.
That distribution has a major implication:
India’s B2B opportunity is substantially broader than the manufacturing economy.
4.1 Three Broad Engines of India's B2B Economy
At the highest level, India’s registered MSME ecosystem can be divided into three activity groups:
| Activity | Registrations* | Approx. share |
|---|---|---|
| Trading | 3.91 crore | 42.1% |
| Services | 3.53 crore | 38.0% |
| Manufacturing | 1.85 crore | 19.9% |
| Total | 9.29 crore | 100% |
Latest Ministry of MSME dashboard data available as of 15 August 2026; figures include the registration categories represented in the dashboard’s activity classification.
The numbers should not be interpreted as a measure of industry revenue or economic contribution. They represent registered enterprises by primary activity, which is a different concept.
Nevertheless, they provide an important market-structure signal.
Trading and services together represent roughly 80% of the registrations in this activity classification, demonstrating why a B2B strategy focused only on manufacturers can overlook a substantial portion of India’s business universe.
EMarket Zone’s State-wise MSME Statistics in India 2026 provides a dedicated reference to this activity distribution and its implications for B2B targeting.
4.2 Manufacturing: The Industrial B2B Engine
Manufacturing occupies a special position in India’s B2B economy because production creates demand throughout a broad network of upstream and downstream businesses.
A manufacturing company may purchase:
• Raw materials
• Components
• Machinery
• Industrial equipment
• Chemicals
• Packaging
• Software
• Engineering services
• Maintenance
• Logistics
• Financial services
• Professional services
This makes manufacturing more than a single industry. It is a network of interdependent B2B markets.
India’s Economic Survey 2025–26 reported that manufacturing grew 8.4% in H1 FY2025–26, helping drive overall industrial growth, while construction grew 7.4% during the same period. The Survey also noted strengthening manufacturing indicators in the following quarter.
The manufacturing opportunity is therefore relevant to both companies selling directly to factories and companies serving the wider industrial ecosystem.
Major manufacturing opportunity areas
Automotive & components
A large ecosystem of OEMs, component manufacturers, engineering suppliers, tooling companies and logistics providers.
Electronics
Increasing domestic production creates demand for components, equipment, automation, testing, packaging and specialized services.
Pharmaceuticals
India’s pharmaceutical manufacturing base supports opportunities across APIs, formulations, packaging, equipment, laboratory services and logistics.
Chemicals & petrochemicals
A major industrial ecosystem with significant demand for machinery, industrial services, safety, logistics and specialized inputs.
Engineering & machinery
A cross-industry supplier market serving manufacturing, infrastructure, construction and industrial production.
Textiles & apparel
An extensive network spanning yarn, fabrics, processing, machinery, garments, packaging, logistics and exports.
The Government’s Production Linked Incentive programmes are also supporting investment in sectors including electronics, automobiles and pharmaceuticals, strengthening the importance of industrial supply-chain opportunities. Ministry of Commerce & Industry – PLI Schemes
4.3 Trading: The Largest Registered Activity Segment
Trading is the largest activity category in the latest MSME dashboard data, with approximately 3.91 crore registrations, representing around 42% of the activity distribution.
This category includes businesses involved in the movement and sale of goods across markets, creating extensive B2B relationships between:
Manufacturers → Distributors → Wholesalers → Retailers → Institutional Buyers
For many B2B suppliers, trading businesses are therefore not simply customers. They can also function as distribution partners and market-access channels.
This is particularly relevant for:
• Consumer-goods suppliers
• Industrial product manufacturers
• Electrical and hardware companies
• Packaging businesses
• Food and agricultural suppliers
• Building-material companies
• Electronics distributors
• Importers and exporters
The commercial opportunity in trading is consequently different from manufacturing.
A machinery company may primarily target manufacturers, while a consumer-product supplier may find distributors and wholesalers more valuable.
The same national business universe therefore produces very different target markets depending on the product.
4.4 Services: India's Largest Structural Growth Engine
Services account for approximately 3.53 crore registrations in the latest MSME dashboard activity classification, or around 38% of the total.
The importance of services extends beyond the number of registered enterprises.
The Economic Survey 2025–26 states that services contribute more than half of India’s Gross Value Added (GVA) and describes the sector as a major driver of exports and employment. It also highlights the increasing importance of digitally deliverable and knowledge-intensive services.
For B2B companies, the services economy creates a wide range of potential customer segments:
• IT services
• Software and SaaS
• Consulting
• Accounting
• Legal services
• Marketing agencies
• Recruitment
• Financial services
• Business-process services
• Education and training
• Healthcare services
• Professional services
The geographic characteristics also differ from manufacturing.
Technology and knowledge-intensive services tend to concentrate around major urban centres, while many other services are distributed much more widely across regional markets.
This makes service-sector targeting particularly dependent on company type and customer profile, not merely geography.
4.5 Technology & Software: A High-Connectivity B2B Segment
Technology is increasingly embedded across India’s business economy rather than operating as an isolated sector.
The ecosystem includes:
• SaaS
• Enterprise software
• Cloud computing
• Cybersecurity
• Artificial intelligence
• Data analytics
• IT services
• Fintech
• Enterprise infrastructure
• Global Capability Centres
The Economic Survey specifically identifies digitally deliverable services and knowledge-intensive activities as important sources of value creation, allowing services to scale beyond traditional geographic constraints.
This creates an unusual B2B characteristic:
A technology company can sell nationally without establishing a physical presence in every customer market.
As a result, technology businesses often have a wider geographic addressable market than location-dependent industries.
However, geographic concentration still matters for enterprise sales because major technology and corporate clusters provide greater density of potential customers and decision-makers.
This is why cities such as Bengaluru, Hyderabad, Pune, Chennai and Delhi NCR remain important technology-oriented B2B markets.
4.6 Healthcare & Pharmaceuticals: Two Different B2B Markets
Healthcare and pharmaceuticals are often grouped together, but commercially they represent different B2B ecosystems.
Pharmaceuticals
The pharmaceutical value chain includes:
API suppliers → manufacturers → packaging → laboratories → distributors → hospitals/pharmacies → export markets
This creates opportunities for industrial suppliers, equipment manufacturers, packaging companies, logistics providers, compliance services and specialized technology companies.
Healthcare services
Healthcare B2B relationships are more likely to involve:
• Hospitals
• Clinics
• Diagnostic centres
• Medical equipment suppliers
• Healthcare technology companies
• Insurance and financial services
• Facility-management providers
• Professional services
The distinction matters because a medical-equipment company may target both pharmaceutical manufacturers and hospitals—but with entirely different sales propositions.
4.7 Logistics: A Cross-Industry B2B Opportunity
Logistics is unusual because it does not depend on one industry.
Almost every major commercial sector requires some combination of:
• Transportation
• Warehousing
• Freight
• Distribution
• Inventory management
• Packaging
• Last-mile delivery
• Supply-chain technology
India’s expanding manufacturing, e-commerce and export ecosystems therefore create demand for logistics services across multiple industries.
The Economic Survey’s discussion of infrastructure and industrial development reinforces the importance of connectivity and logistics to India’s growth model.
For B2B companies, logistics can therefore be treated as a horizontal opportunity sector—one that cuts across manufacturing, trading, retail, pharmaceuticals, food processing and exports.
4.8 Construction & Infrastructure: A Project-Driven B2B Market
onstruction differs from many recurring B2B markets because demand is often linked to projects, contracts and infrastructure cycles.
Its ecosystem includes:
• Contractors
• Engineering firms
• Architects
• Building-material suppliers
• Equipment companies
• Electrical suppliers
• Plumbing businesses
• Safety suppliers
• Infrastructure companies
• Real-estate businesses
• Professional services
The Economic Survey reported 7.4% construction growth in H1 FY2025–26, supported by public capital expenditure and infrastructure activity.
For suppliers, the commercial opportunity can therefore depend on identifying where projects and construction ecosystems are concentrated, rather than simply counting construction businesses nationally.
4.9 Financial & Business Services
Financial services represent another important B2B layer.
Businesses require:
• Banking
• Payments
• Lending
• Insurance
• Accounting
• Tax services
• Investment services
• Compliance
• Payroll
• Corporate finance
• Business advisory
The increasing formalization of India’s business ecosystem expands the potential addressable market for these services.
At the same time, financial and professional services are heavily concentrated in major commercial centres, particularly Mumbai, Delhi NCR, Bengaluru and other large urban markets.
This creates an important interaction between company density and service demand.
4.10 Emerging B2B Opportunity Sectors
The mature sectors above form the current foundation. The next layer consists of industries where investment, technology adoption or policy support could expand future B2B demand.
Several stand out:
Artificial Intelligence & Automation
Demand can extend from software and computing infrastructure to consulting, integration, cybersecurity and workforce services.
Electric Vehicles
The opportunity spans vehicles, batteries, charging infrastructure, electronics, components, software and maintenance.
Renewable Energy
Solar, wind, storage and grid-related investment create opportunities across equipment, engineering, installation, maintenance and finance.
Semiconductors & Electronics
The ecosystem extends beyond chip manufacturing into equipment, components, testing, packaging, industrial automation and specialized services.
Biotechnology
Demand spans laboratory equipment, research services, manufacturing inputs, data infrastructure and specialized professional services.
Data Centres
Growth creates requirements for power systems, cooling, construction, security, networking, equipment and specialized services.
The key point is that an emerging sector becomes commercially interesting for B2B companies when it creates a network of suppliers and service providers, not merely when the headline industry grows.
EMarket Zone’s Fastest-Growing Business Sectors in India 2026 provides a separate analysis of several of these emerging sectors.
4.11 Industry Opportunity Is a Value-Chain Question
A common mistake is to evaluate industries only by the number of companies operating within them.
A stronger approach is to map the entire value chain.
Consider electric vehicles:
Raw Materials
↓
Battery & Components
↓
Vehicle Manufacturing
↓
Software & Electronics
↓
Distribution
↓
Charging Infrastructure
↓
Maintenance & Services
A B2B company may find its strongest opportunity at any point in this chain.
The same principle applies to pharmaceuticals, electronics, automotive, food processing and other complex industries.
Therefore:
Industry opportunity should be evaluated by ecosystem depth, not just industry size.
4.12 Industry × Geography Creates the Real Opportunity Map
The strongest B2B analysis emerges when industry and geography are combined.
For example:
| Industry | High-relevance markets |
|---|---|
| Technology & SaaS | Bengaluru, Hyderabad, Pune, Chennai, Delhi NCR |
| Automotive & Engineering | Pune, Chennai, Gurugram, Bengaluru, Ahmedabad |
| Pharmaceuticals | Hyderabad, Ahmedabad, Mumbai, Pune, Bengaluru |
| Chemicals | Gujarat, Maharashtra, Tamil Nadu |
| Textiles & Apparel | Gujarat, Tamil Nadu, Maharashtra |
| Logistics | Delhi NCR, Mumbai, Chennai, Hyderabad, Bengaluru |
| Financial Services | Mumbai, Delhi NCR, Bengaluru |
| Electronics | Tamil Nadu, Karnataka, Uttar Pradesh, Telangana |
| Food Processing | Uttar Pradesh, Maharashtra, Gujarat, Andhra Pradesh, Punjab |
These are market-pattern examples, not a universal ranking. A company should still apply its own product, company-size and customer-profile filters.
This is the point at which the report moves from broad business statistics toward practical market selection.
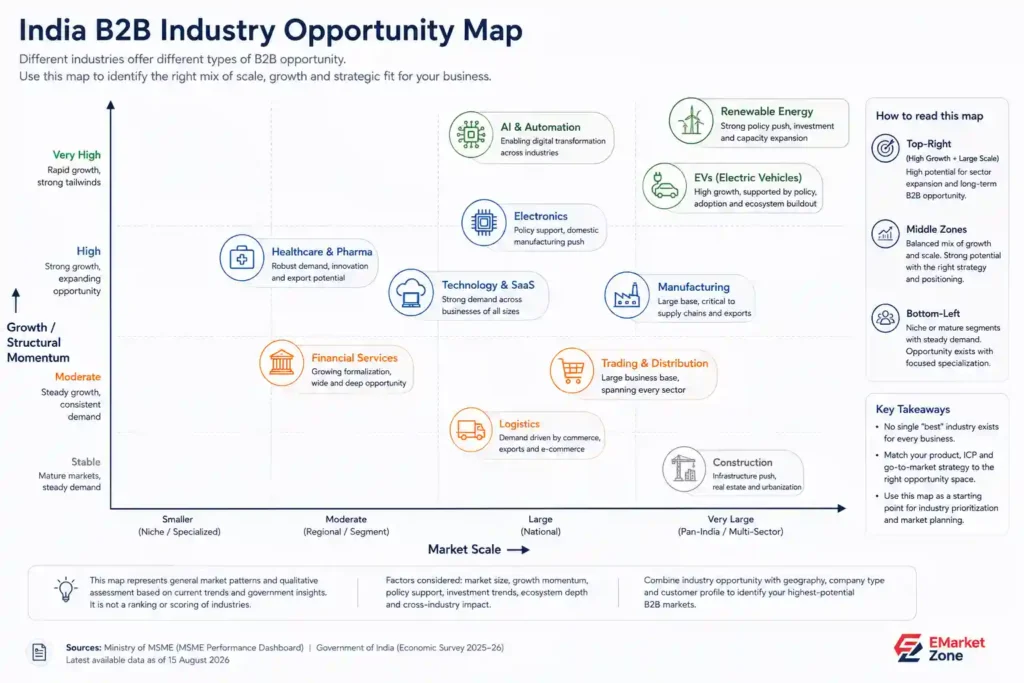
4.13 The B2B Opportunity Matrix
Industry opportunity can be evaluated across four dimensions:
Market Scale
How large is the potential business universe?
Growth Momentum
Is the sector expanding or undergoing structural investment?
Ecosystem Depth
How many supporting businesses exist around the core industry?
Commercial Fit
How closely does the sector match the company’s product or service?
A sector with high growth but a small addressable customer base may be attractive for a specialist provider.
A large, mature sector may be more suitable for a scalable horizontal B2B service.
The correct answer depends on the company’s strategy.
4.14 What the Industry Data Means for B2B Strategy
The evidence points to three distinct B2B opportunity models.
Horizontal markets
Businesses that sell across many industries.
Examples:
• Accounting software
• HR services
• Digital marketing
• Cybersecurity
• Business communication tools
These companies benefit from broad business coverage.
Vertical markets
Businesses serving a particular industry.
Examples:
• Pharmaceutical equipment
• Automotive components
• Hospital software
• Industrial automation
These companies benefit from deep industry segmentation.
Ecosystem markets
Businesses serving a complete commercial cluster.
Examples:
• Logistics
• Industrial finance
• Packaging
• Supply-chain technology
• Business intelligence
These companies benefit from targeting multiple connected businesses within the same ecosystem.
This distinction is critical when converting business data into an actionable B2B market strategy.
Key Takeaways
01 – India’s B2B economy is broader than manufacturing.
The latest MSME activity data shows trading and services together account for roughly four-fifths of registrations in the dashboard’s activity classification.
02 – Manufacturing remains strategically important.
Its supply chains create demand across machinery, components, logistics, industrial services, technology and professional support.
03 – Services are a structural growth engine.
The Economic Survey reports that services contribute more than half of India’s GVA and remain an important source of exports and employment.
04 – Emerging sectors matter because of their ecosystems.
AI, EVs, renewable energy, electronics, biotechnology and data centres can create new layers of B2B suppliers and service providers.
05 – Industry alone is not enough.
The most useful opportunity map combines industry + geography + company type + customer profile.
Chapter 5 (The Private Limited Company Opportunity)
Introduction
India’s B2B market is broad, but not every business represents the same type of commercial opportunity.
For many B2B products and services, private limited companies form a particularly relevant target segment because they sit within India’s formal corporate ecosystem and typically operate through a defined legal, governance and reporting structure.
The Ministry of Corporate Affairs (MCA) is the central authority responsible for administering India’s corporate legal framework and maintaining the country’s corporate registry. Ministry of Corporate Affairs — Government of India
This makes private limited companies an important lens through which to examine India’s addressable B2B market.
However, one distinction is essential from the outset:
A private limited company is a legal form, not a measure of company size, quality or purchasing power.
A private company may be a large corporate organization, a mid-sized manufacturer, a technology startup or a small operating business. Consequently, private-company status should be treated as one segmentation filter, not as a universal indicator of commercial value.
5.1 The Scale of India's Corporate Company Base
The scale of India’s corporate ecosystem is substantial.
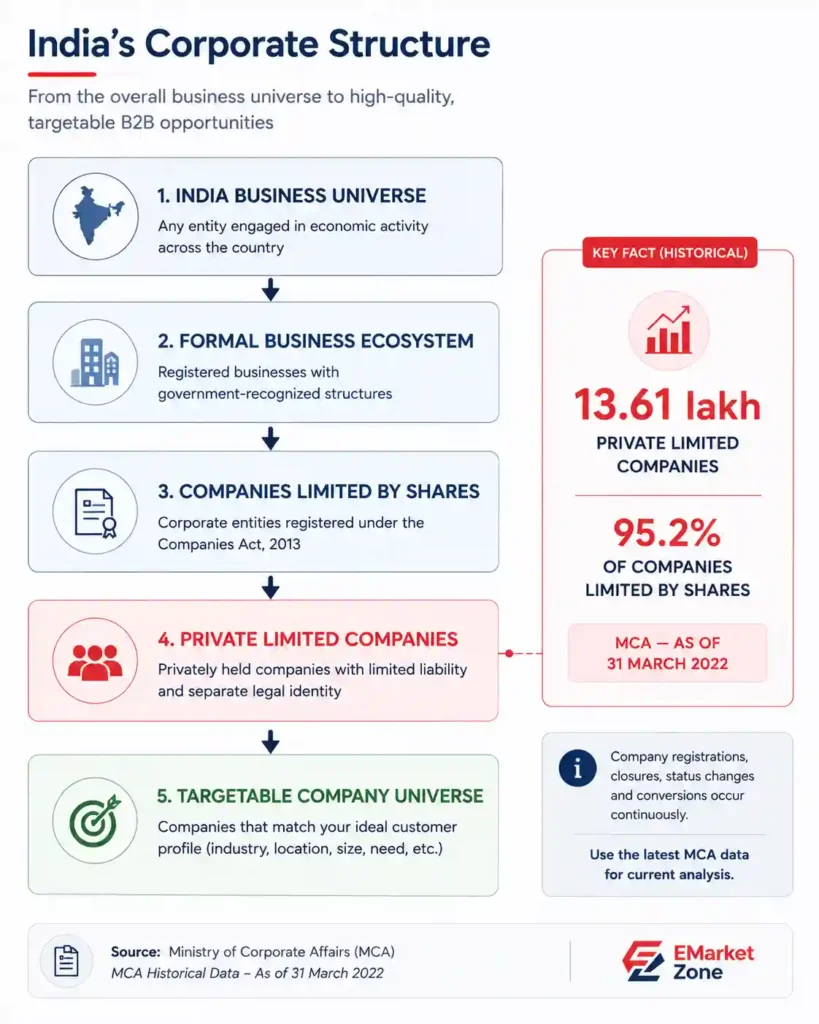
MCA’s historical company data shows that, as of 31 March 2022, India had 14.28 lakh active companies limited by shares, of which 13.61 lakh were private limited companies. Private limited companies therefore represented approximately 95.2% of companies limited by shares in that dataset.
This historical figure should not be presented as India’s current 2026 private-company count. Company registrations, closures, status changes and conversions occur continuously.
Its value for this report is structural:
Private companies constitute the overwhelming majority of India’s formal companies limited by shares.
That makes them too large and commercially diverse a segment to treat as a niche corporate category.
5.2 Why Private Companies Matter to B2B Markets
Private companies can occupy almost every part of the B2B value chain.
They can operate as:
• Manufacturers
• Importers
• Exporters
• Distributors
• Technology companies
• Professional-service firms
• Construction companies
• Healthcare businesses
• Logistics providers
• Financial-service companies
• Industrial suppliers
• Consumer-product companies
A B2B seller therefore should not ask simply:
“How many private companies are there?”
The more useful question is:
“Which private companies match the commercial profile of the product or service?”
This distinction prevents private-company data from becoming another broad business list.
5.3 Private Limited Does Not Mean Large
One of the most important analytical cautions in using company-structure data is the assumption that incorporation type indicates company scale.
It does not.
A private limited company can range from a newly incorporated startup to a large established enterprise.
Startup India itself recognizes private limited companies as one of the principal legal forms through which startups can be incorporated, alongside LLPs, registered partnerships and eligible cooperative structures.
This creates a wide spectrum:
Newly incorporated company
→ Early-stage business
→ Growing SME
→ Established mid-market company
→ Large corporate organization
All may be classified as private limited companies.
Therefore, company age, turnover, employee scale, industry and operating status must be layered onto legal structure when assessing commercial opportunity.
5.4 The Formal Corporate Layer of the B2B Economy
Private limited companies occupy an important position between India’s broader business universe and its publicly listed corporate sector.
A simplified structure looks like this:
India’s Overall Business Universe
↓
Formal Registered Businesses
↓
Corporate Entities
↓
Companies Limited by Shares
↓
Private Limited Companies
↓
Target Company Profile
The final stage is where commercial targeting begins.
For example, an enterprise software provider may narrow the market to:
Private Limited Companies
→ Technology & Professional Services
→ 50+ employees
→ Bengaluru / Hyderabad / Pune
→ Growing companies
→ Companies matching the software’s ICP
The resulting market is far smaller than the total private-company population—but substantially more relevant.
5.5 Private Companies Across Major B2B Industries
Private companies are distributed across virtually every major B2B sector.
Manufacturing
Private companies can include:
• Component manufacturers
• Engineering companies
• Machinery producers
• Chemical manufacturers
• Packaging companies
• Electronics businesses
• Textile manufacturers
Their purchasing requirements can include machinery, raw materials, software, logistics, finance and industrial services.
Technology
The technology ecosystem contains large numbers of privately held:
• SaaS companies
• IT service providers
• Software companies
• AI companies
• Cybersecurity firms
• Consulting businesses
• Digital agencies
The segment can be particularly attractive to vendors selling subscription software and professional services.
Trading & Distribution
Private companies can operate as:
• Wholesalers
• Distributors
• Importers
• Exporters
• Dealers
• Regional channel partners
For manufacturers, these companies may represent routes to market, rather than conventional end customers.
Healthcare & Pharmaceuticals
Private companies operate across:
• Pharmaceutical manufacturing
• Medical equipment
• Diagnostics
• Healthcare technology
• Hospitals and clinics
• Distribution
• Laboratory services
Construction & Infrastructure
Private contractors, engineering companies, developers and suppliers form a major part of project-based B2B ecosystems.
The result is a highly diversified private-company market.
5.6 Geographic Concentration Matters
Private-company opportunity is not distributed uniformly across India.
The broader corporate ecosystem is strongly concentrated around major business centres, with Maharashtra, Delhi, Karnataka, Tamil Nadu, Gujarat, Telangana and other major economic states playing important roles.
MCA’s historical data also showed Maharashtra as the state with the largest number of active companies as of March 2022, followed by Delhi and West Bengal.
This reinforces the geographic logic established earlier in the report.
A company targeting private businesses should not necessarily begin with a nationwide list.
A stronger approach is:
State
→ City
→ Industry
→ Private Company
→ Company Size
→ ICP
This produces a much more commercially meaningful target universe.
For the broader geographic context, readers can refer back to the geographic concentration analysis in this report and the India Business Landscape Report 2026.
5.7 The Difference Between Registered and Active Companies
This distinction is particularly important when using corporate data.
A company may be:
• Newly incorporated
• Active
• Dormant
• Under regulatory action
• In the process of closure
• Struck off
• Converted into another legal structure
Consequently, registered-company counts should not automatically be treated as active prospect counts.
For B2B market intelligence, data quality should therefore consider at least:
Legal status
Last available activity
Industry classification
Location
Company age
Contactability
Duplicate records
This is one reason why raw corporate registries and commercial prospecting datasets serve different purposes.
The registry provides authoritative legal information; a prospecting system requires additional segmentation and usability layers.
5.8 Private Company Opportunity by Business Objective
Different B2B businesses can use the private-company segment differently.
| Business objective | Useful private-company segment |
|---|---|
| Enterprise software | Established companies with relevant technology needs |
| HR services | Growing companies with expanding teams |
| Financial services | Companies requiring banking, credit or financial solutions |
| Industrial equipment | Private manufacturers and industrial businesses |
| Logistics | Manufacturers, distributors, importers and exporters |
| Marketing services | Growing consumer-facing and B2B companies |
| Recruitment | Technology, services and high-growth companies |
| Business consulting | Mid-market and established companies |
| Compliance services | Companies with recurring statutory requirements |
| B2B marketplaces | Suppliers, manufacturers and distributors |
The same corporate structure can therefore produce completely different target markets depending on the commercial objective.
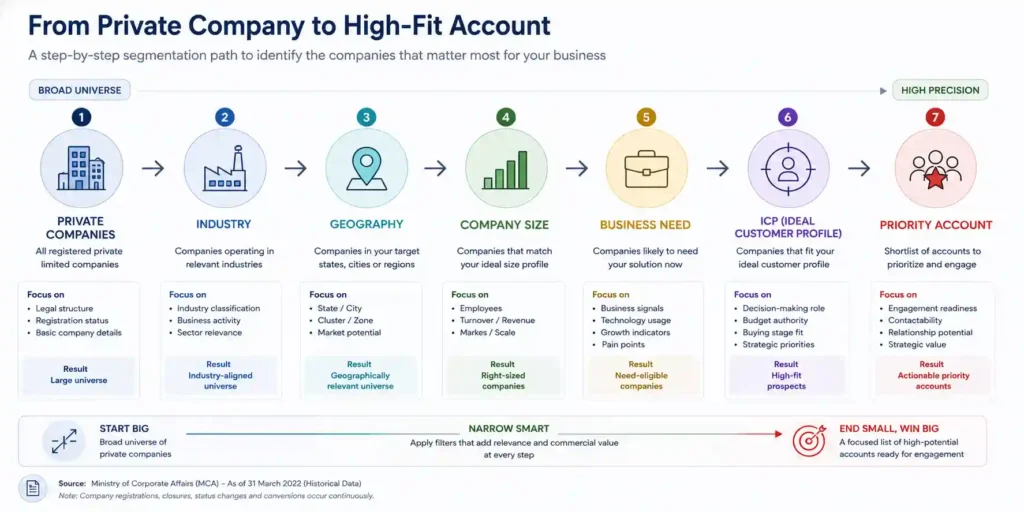
5.9 From Company Database to Company Intelligence
A list of company names is not the same thing as market intelligence.
For B2B purposes, useful company intelligence should ideally allow segmentation by:
Company
Industry
Location
Company type
Operating status
Size
Business activity
Decision-maker information
Contact channels
The first five primarily describe the organization.
The last layers determine whether the organization can actually be identified, prioritized and reached.
This distinction becomes increasingly important as B2B sales teams move from mass prospecting toward account-based strategies.
Key Insights
01 – Private limited companies form the dominant part of India’s companies-limited-by-shares ecosystem. MCA data for March 2022 recorded 13.61 lakh private limited companies out of 14.28 lakh companies limited by shares.
02 – Private limited status does not indicate company size. The segment includes startups, SMEs, mid-market companies and large organizations.
03 – Geography and industry must be layered onto company structure. A national private-company universe is too broad for most B2B applications.
04 – Active status matters. Registered companies should not automatically be interpreted as active or contactable prospects.
05 – The commercial objective determines the useful segment. The right private-company market for a software provider may be completely different from the right market for an industrial supplier.
Looking for verified business contacts or industry-specific business data? Explore EMarket Zone’s database solutions.
Chapter 6 (B2B Opportunity by Company Segment)
Introduction
Identifying the right industry and geography narrows India’s business universe, but it still leaves a fundamental question unanswered:
Which types of companies should a B2B business prioritize?
Two companies operating in the same industry and city can have completely different commercial value. One may be a newly established micro enterprise with limited purchasing requirements. Another may be a rapidly expanding mid-sized company with multiple locations, a growing workforce and an active technology or supplier requirement.
This makes company segmentation a critical stage between market mapping and account selection.
The objective is not to create a hierarchy in which larger companies are automatically considered better. Instead, the objective is to identify different company segments with different commercial characteristics.
6.1 Company Size Is More Than a Number
India’s MSME framework provides an established way to classify enterprises using investment in plant and machinery/equipment and annual turnover.
From 1 April 2025, the Government revised the classification thresholds:
| Category | Investment limit | Turnover limit |
|---|---|---|
| Micro | Up to ₹2.5 crore | Up to ₹10 crore |
| Small | Up to ₹25 crore | Up to ₹100 crore |
| Medium | Up to ₹125 crore | Up to ₹500 crore |
These revised criteria were notified by the Ministry of MSME in March 2025.
This classification is useful because it provides a standardized framework for understanding enterprise scale. But MSME classification should not be confused with B2B sales segmentation.
A company’s MSME category tells us something about its scale under the government framework. It does not tell us:
• whether it needs a particular product;
• whether it has purchasing authority;
• whether it is growing;
• whether it is actively buying;
• whether it is a good customer fit.
Those questions require additional signals.
6.2 Four Broad Company Segments
For B2B market analysis, India’s business universe can be considered through four practical segments:
Micro & Small Businesses
Large in number and highly diverse.
Potential characteristics:
• Owner-led decision-making
• Shorter purchasing cycles
• Strong price sensitivity
• Regional customer bases
• High demand for practical business solutions
Potential B2B opportunities include affordable software, financial services, marketing, accounting, distribution and operational services.
Mid-Market Companies
Often more structurally complex than micro businesses while remaining more accessible than large enterprises.
Potential characteristics:
• Growing teams
• Multiple departments
• Formal procurement
• Increasing technology adoption
• Expansion into new markets
• Recurring supplier requirements
For many B2B providers, this segment can represent an attractive balance between market size and account value.
Large Enterprises
Large organizations can provide substantial contract value but typically involve:
• Longer sales cycles
• Multiple decision-makers
• Procurement processes
• Vendor evaluations
• Security and compliance requirements
• Higher implementation expectations
The opportunity is potentially large, but the cost of acquisition can also be substantially higher.
High-Growth / Emerging Companies
This is a different segmentation dimension.
A company may be relatively small today but expanding rapidly.
Growth indicators can include:
• Recent incorporation
• Hiring
• New locations
• Funding
• New product launches
• Geographic expansion
• Increasing digital adoption
Startup India, for example, defines DPIIT-recognized startups using criteria that include incorporation type, age, turnover and innovation/scalability. The current framework allows eligible startups up to 10 years from incorporation, with a ₹200 crore turnover threshold for standard recognition and ₹300 crore for DeepTech startups.
This demonstrates why company age and growth status can be useful segmentation variables alongside size.
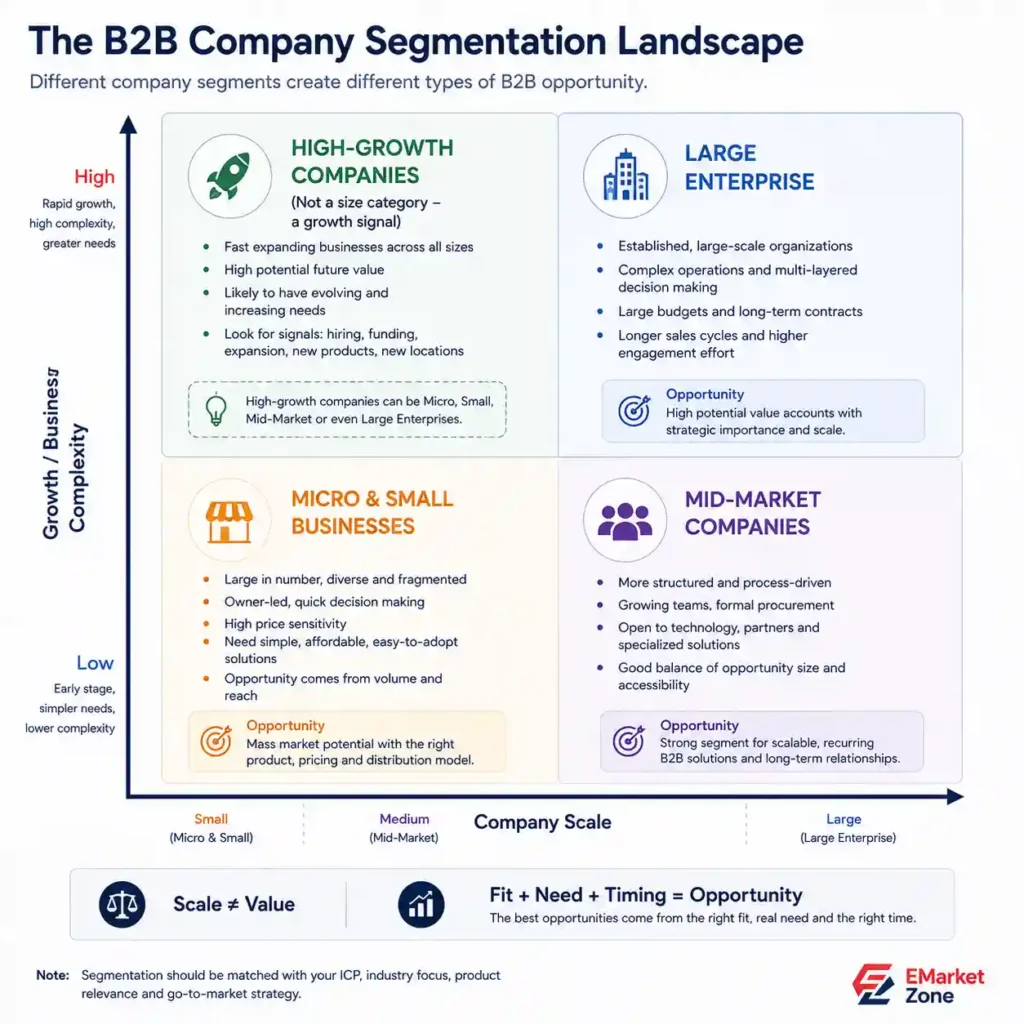
6.3 The Same Company Can Belong to Multiple Segments
Segmentation should not be treated as mutually exclusive boxes.
A company can simultaneously be:
• Private Limited
• Medium Enterprise
• Manufacturing
• Export-oriented
• High-growth
Each attribute answers a different question.
This creates a multidimensional company profile:
| Attribute | What it tells us |
|---|---|
| Legal structure | How the organization is constituted |
| Industry | What the company does |
| Geography | Where it operates |
| Size | Approximate business scale |
| Age | Stage of organizational development |
| Growth signals | Potential change in future demand |
| Business model | How the company creates revenue |
| Need | Why it may purchase a solution |
The commercial value comes from combining these attributes.
6.4 Micro Businesses: Scale Through Volume
Micro businesses represent a very large part of India’s business ecosystem.
Their commercial attractiveness often comes from volume rather than individual account value.
A company selling a ₹1,000–₹10,000 annual service may find thousands or millions of micro businesses potentially relevant.
However, the economics change dramatically for a high-ticket enterprise product.
For micro businesses, B2B providers generally need to consider:
• Low acquisition cost
• Simple onboarding
• Short sales cycles
• Digital self-service
• Price sensitivity
• High-volume acquisition
A business should therefore avoid assuming that the largest available database of micro businesses automatically represents the largest commercial opportunity.
The economics of serving the segment matter.
6.5 Small Businesses: The Commercial Middle Ground
Small enterprises can occupy an interesting position between micro businesses and more established companies.
They may have:
• More formal processes
• Dedicated employees
• Established customer bases
• Multiple suppliers
• Growing technology requirements
• Greater willingness to outsource
At the same time, decision-making can remain relatively fast compared with large enterprises.
This can make the segment attractive for B2B providers selling:
• CRM
• Accounting software
• HR tools
• Digital marketing
• Business communication
• Logistics
• Financial services
• Professional services
The key question is not whether small businesses are attractive universally, but which small businesses have the operational problem that the product solves.
6.6 Mid-Market Companies: The Complexity Advantage
The mid-market often becomes more interesting as a company moves beyond basic operations.
Growth can introduce new requirements:
More employees
→ More processes
→ More customers
→ More suppliers
→ More locations
→ More data
→ More operational complexity
That complexity creates demand for specialized B2B solutions.
For example, a company with 10 employees may manage operations through spreadsheets and basic communication tools.
A company with 150 employees operating across three locations may require:
• CRM
• ERP
• HR technology
• Cybersecurity
• Procurement systems
• Business intelligence
• Managed services
This creates a useful B2B principle:
Operational complexity can be a stronger purchasing signal than company size alone.
6.7 Large Enterprises: High Value, Higher Friction
Large enterprises can represent some of the highest-value B2B accounts.
However, the sales process can be substantially more demanding.
A typical enterprise purchase may involve:
Business sponsor
→ Functional team
→ IT / security
→ Finance
→ Procurement
→ Legal
→ Senior approval
The number of stakeholders can increase the time and resources required to close an account.
This creates a trade-off:
| Enterprise advantage | Enterprise challenge |
|---|---|
| High potential contract value | Long sales cycle |
| Larger budgets | Complex procurement |
| Recurring requirements | Multiple decision-makers |
| Expansion potential | High competition |
| Strong reference value | Higher acquisition cost |
Therefore, enterprise targeting makes sense when the company’s product economics can support the acquisition process.
6.8 Startups and High-Growth Companies
Growth-stage businesses deserve separate consideration because current size may understate future demand.
A startup with 20 employees today could become a much larger organization over the next several years.
The more useful signals may therefore include:
• Recent funding
• Hiring velocity
• New office locations
• Geographic expansion
• Product launches
• Partnerships
• Export activity
• Technology adoption
Startup India notes that DPIIT-recognized startups are expected to demonstrate innovation or improvement of products, processes or services and potential for employment or wealth creation.
For B2B providers, this means a startup segment can be valuable where the product is tied to growth-stage requirements.
Examples include:
• Cloud services
• Recruitment
• SaaS
• Financial services
• Legal and compliance
• Marketing
• Business intelligence
• Office infrastructure
But again, startup does not automatically mean high-value.
Growth signals must be connected to product fit.
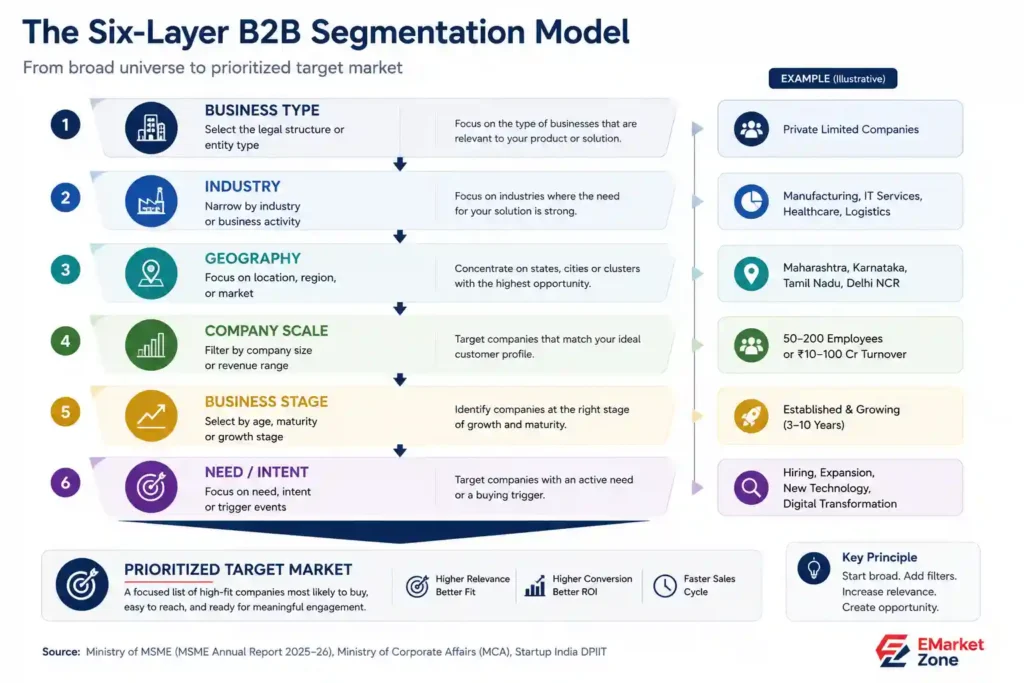
6.9 The Optimal Target Market Is Usually Smaller Than Expected
A recurring mistake in B2B planning is to start with the largest possible market.
That approach sounds attractive:
“There are millions of potential businesses.”
But a large universe does not automatically produce a large addressable market.
If only 10% match the industry, 20% match the geography, 30% match the company profile and 40% have a relevant need, the genuinely relevant universe becomes dramatically smaller.
That is not a weakness.
It is the objective of segmentation.
A smaller, highly relevant market can be easier to sell into, cheaper to reach and more profitable to serve.
Key Insights
01 – Company size is an important segmentation variable, but it is not enough on its own.
02 – India’s revised MSME classification provides a useful standardized framework from 1 April 2025.
03 – Mid-market companies can offer an attractive balance between account value and sales complexity.
04 – Startups and high-growth businesses should be evaluated using growth signals, not simply company age or incorporation type.
05 – Manufacturers, distributors, exporters and service companies have fundamentally different B2B purchasing and partnership structures.
06 – Business need and commercial signals can be more predictive than static company characteristics.
07 – The objective of segmentation is not to maximize the number of prospects. It is to maximize the proportion of prospects that are commercially relevant.
India’s MSME sector represents the foundation of the country’s entrepreneurial and industrial ecosystem. With millions of enterprises spread across diverse industries and regions, MSMEs contribute substantially to employment, manufacturing, exports, innovation, and inclusive economic growth. As digital adoption, government support, and global market opportunities continue to expand, MSMEs are well positioned to become even more competitive, resilient, and globally connected over the remainder of the decade.
Chapter 7 (Identifying High-Opportunity B2B Markets)
Introduction
India’s business universe is large enough that market selection becomes a strategic problem in its own right.
The preceding sections established three important layers: businesses are geographically concentrated, industries have different economic structures, and companies vary substantially in scale, stage and commercial needs. The next step is to combine those variables and determine which combinations are most likely to represent attractive B2B markets.
A large business population is not necessarily a high-opportunity market. A fast-growing industry is not automatically attractive if its addressable customer base is small. Likewise, a major city may have enormous commercial activity but relatively poor fit for a specialized B2B offering.
The objective of this section is therefore not to publish another arbitrary ranking of India’s “best markets.” It is to establish a repeatable framework for identifying high-opportunity B2B markets.
7.1 Opportunity Is a Combination, Not a Single Metric
A B2B market becomes attractive when several conditions overlap:
Relevant businesses
Strong industry fit
Sufficient market scale
Business concentration
Commercial accessibility
Evidence of demand or growth
The importance of this combined approach is also reflected in India’s evolving cluster strategy.
The Economic Survey 2025–26 notes that India has developed numerous industrial clusters, but also identifies scale, connectivity and regulatory flexibility as important factors in determining whether clusters can become globally competitive ecosystems. It specifically highlights the potential of well-connected, high-potential regions and notes that manufacturing activity is expanding beyond metropolitan centres into Tier-2 and Tier-3 cities.
This provides an important distinction:
Business concentration creates potential; ecosystem quality determines how commercially useful that concentration can become.
7.2 The Five Dimensions of B2B Opportunity
This report evaluates opportunity through five dimensions.
1. Market Scale
How large is the potential business universe?
A market with thousands of relevant companies provides a fundamentally different commercial opportunity from a market containing only a few hundred.
Scale matters particularly for:
• Horizontal SaaS
• Financial services
• Business services
• Marketing services
• Recruitment
• Logistics
• General B2B products
But scale should never be considered independently.
2. Industry Relevance
How closely does the market’s dominant industry match the product or service?
A cybersecurity provider may find a technology-heavy market more attractive than a market containing twice as many businesses but fewer technology-intensive companies.
Similarly, an industrial-equipment supplier may prioritize manufacturing clusters over broad commercial centres.
This is why the industry analysis in Section 5 is a necessary layer between business counts and opportunity assessment.
3. Company-Profile Fit
The right industry can still contain the wrong companies.
A product designed for mid-sized manufacturers may have little relevance to:
• Micro retailers
• Sole proprietors
• Early-stage service businesses
• Large enterprises with existing enterprise systems
The target market therefore needs to be filtered by:
Company type → Scale → Stage → Operating model → Business need
The six-layer segmentation framework introduced in Section 7 provides the basis for this filtering.
4. Ecosystem Depth
A market becomes more interesting when businesses are connected through supplier, customer and service relationships.
Consider an industrial cluster.
A manufacturer can generate demand for:
• Component suppliers
• Machinery
• Packaging
• Logistics
• Maintenance
• Software
• Financial services
• Recruitment
• Compliance
• Professional services
One industry therefore creates a much larger commercial ecosystem around itself.
This is particularly relevant for B2B businesses that sell into business networks rather than individual companies.
5. Market Accessibility
A market can be large and relevant but still difficult to serve.
Accessibility can depend on:
• Transport connectivity
• Digital infrastructure
• Availability of skilled labour
• Distribution networks
• Sales coverage
• Cost of customer acquisition
• Regulatory environment
• Competition
The Economic Survey’s recent analysis of industrial clusters reinforces this point: infrastructure, multimodal connectivity and scale are important conditions for turning clusters into more productive and globally competitive ecosystems.
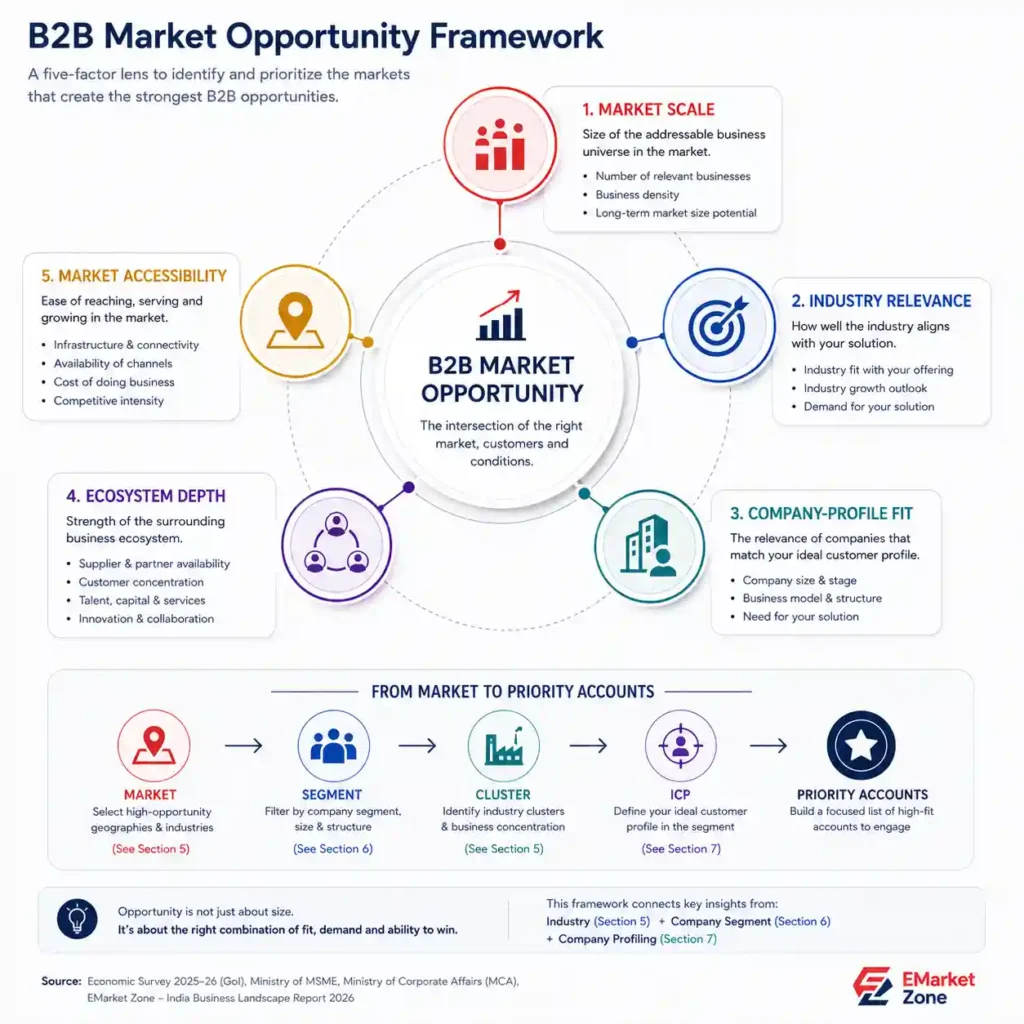
7.3 A B2B Opportunity Model
The five dimensions can be expressed conceptually as:
B2B Opportunity
Market Scale
×
Industry Relevance
×
Company-Profile Fit
×
Ecosystem Depth
×
Market Accessibility
This is a decision framework, not a statistical formula.
We deliberately do not assign arbitrary weights to each factor and then present a precise “87/100 opportunity score.” Without a transparent dataset capable of measuring every variable consistently, such precision would be misleading.
The framework is more useful as a structured way to compare markets.
7.4 Four Types of High-Opportunity Markets
Applying this framework produces four broad types of B2B opportunity.
Type A – Scale Markets
These are markets with a large and diverse business universe.
Typical characteristics:
• Large number of businesses
• Multiple industries
• Strong commercial infrastructure
• Large customer base
• Diverse company profiles
Examples include major metropolitan and high-business-density states.
These markets are particularly useful for companies seeking volume and broad addressable demand.
Type B – Industry Cluster Markets
These markets may be smaller than major metros but have a high concentration of a particular industry.
Examples can include:
• Automotive clusters
• Textile clusters
• Pharmaceutical clusters
• Engineering clusters
• Chemical clusters
• Electronics clusters
The Economic Survey specifically discusses the importance of industrial clustering and notes examples of emerging advanced-manufacturing clusters outside India’s largest metropolitan centres.
For a vertical B2B company, these markets can be considerably more attractive than a large but generalized city.
Type C – Growth Markets
These are markets where the current business base may not yet be the largest, but investment, infrastructure, technology adoption or business expansion is creating future demand.
Potential signals include:
• New industrial investment
• New infrastructure
• Rising corporate presence
• Expansion of manufacturing
• New technology ecosystems
• Increasing business registrations
• New logistics connectivity
This category is particularly important because historical business concentration can lag behind actual market development.
A city may have a smaller current business base but be developing the infrastructure required to support substantially more commercial activity.
Type D – Niche High-Fit Markets
These are smaller markets where the fit between the target product and the business ecosystem is unusually strong.
For example:
A company selling specialized textile-production software may find a concentrated textile cluster more valuable than a generic national market.
A supplier of pharmaceutical packaging may prioritize pharmaceutical manufacturing hubs.
A logistics company specializing in exports may focus on export-intensive industrial regions.
These markets demonstrate the most important principle in the report:
A smaller market with exceptional customer fit can be more valuable than a much larger market with weak fit.
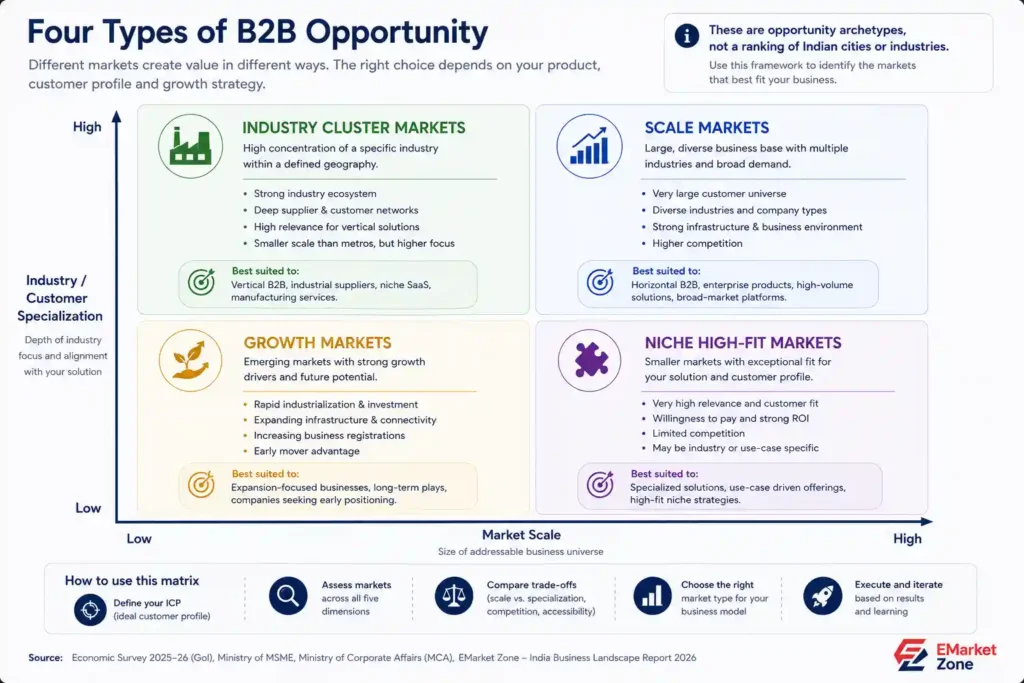
7.5 Market Scale and Market Specialization Are Different
The difference can be visualized through a simple comparison.
| Market type | Scale | Specialization | Typical opportunity |
|---|---|---|---|
| Major metropolitan market | Very high | Moderate–high | Broad B2B |
| Industrial cluster | Medium | Very high | Vertical B2B |
| Emerging business hub | Medium | Developing | Expansion |
| Regional commercial centre | Medium | Variable | Regional B2B |
| Specialized niche market | Small | Very high | High-fit B2B |
This is why the report avoids producing one universal list of “top B2B markets.”
There is no single answer.
The appropriate market depends on what is being sold and who needs it.
7.6 The India Opportunity Map: Geography × Industry
The strongest market-selection model combines two of the report’s most important dimensions:
Geography
State → City → Cluster
with
Industry
Sector → Sub-sector → Value Chain
This creates a market matrix.
For example:
Maharashtra × Manufacturing
may produce one opportunity profile.
Karnataka × Technology
produces another.
Tamil Nadu × Automotive
produces another.
Gujarat × Chemicals
produces another.
Hyderabad × Pharmaceuticals
produces another.
The number of businesses in each geography is only the beginning. The commercial opportunity emerges from the intersection of geography and industry.
This is precisely why the India Business Landscape Report 2026 should remain part of the internal research architecture: Paper 1 establishes the broader business geography, while this report uses that foundation to examine commercial opportunity within the business landscape.
7.7 Opportunity Is Also a Company-Stage Question
Two markets with identical industry and geographic characteristics can still have very different B2B potential if the company populations differ.
Consider:
Market A
Mostly mature companies with established vendors.
Market B
Large number of growing companies actively:
• Hiring
• Expanding
• Opening locations
• Digitizing operations
• Adding suppliers
• Entering new markets
For many B2B products, Market B may represent stronger immediate opportunity.
This is why business stage and commercial signals should be layered onto static company information.
The segmentation model developed earlier in this report provides a way to make that distinction.
7.8 Established Markets vs Emerging Markets
India’s B2B opportunity is increasingly distributed between established centres and emerging markets.
Established markets
Their strengths typically include:
• Business density
• Skilled workforce
• Established infrastructure
• Corporate concentration
• Supplier ecosystems
• Financial and professional services
Emerging markets
Their potential can come from:
• Lower costs
• New infrastructure
• Industrial expansion
• Proximity to raw materials
• Government-supported clusters
• Growing regional demand
The Economic Survey 2025–26 explicitly notes that manufacturing is expanding beyond metropolitan cities into Tier-2 and Tier-3 locations, where lower land, real-estate and wage costs and proximity to raw materials can provide competitive advantages.
This means B2B market selection should not rely exclusively on historical business concentration.
Current scale and future potential are different dimensions.
7.9 The Opportunity–Competition Trade-Off
A high-opportunity market can also be a highly competitive market.
Major commercial centres often offer:
Large customer base
but also:
Large number of competing suppliers
An emerging market may offer:
Smaller customer base
but potentially:
Lower competitive intensity
This creates a strategic trade-off.
A company with a differentiated product and strong sales resources may prefer a large competitive market.
A smaller company may achieve better returns by dominating a specialized regional or industry niche first.
Therefore, opportunity should always be considered alongside competitive intensity and the company’s ability to execute.
7.10 A Practical Market Prioritization Framework
For a B2B company entering a new market, the decision process can follow seven stages:
Step 1 – Define the ICP
Who is the ideal customer?
Step 2 – Identify relevant industries
Which industries have the problem the product solves?
Step 3 – Map geographic concentration
Where are those industries concentrated?
Step 4 – Filter company profiles
Which company sizes, structures and stages are relevant?
Step 5 – Assess ecosystem depth
Are there enough suppliers, customers and supporting businesses?
Step 6 – Assess accessibility and competition
Can the company reach and serve the market economically?
Step 7 – Prioritize
Select the markets with the strongest combined fit.
This approach transforms market expansion from:
“Which city should we target?”
into:
“Which market has the highest concentration of companies that fit our commercial model?”
7.11 Three Market Profiles
To make the framework practical, consider three hypothetical markets.
Market A – Large Metro
Business density: Very high
Industry diversity: High
Competition: High
Accessibility: High
Best suited to:
Horizontal B2B products, enterprise services and businesses capable of competing at scale.
Market B – Specialized Industrial Cluster
Business density: Moderate
Industry concentration: Very high
Competition: Moderate
Ecosystem depth: High
Best suited to:
Industrial suppliers, vertical SaaS, manufacturing services and specialized B2B providers.
Market C – Emerging Regional Hub
Business density: Growing
Industry concentration: Developing
Competition: Potentially lower
Growth potential: High
Best suited to:
Expansion-focused businesses willing to establish an early position.
None is universally superior.
The appropriate choice depends on the company’s product, customer economics, competitive position and growth strategy.
7.12 Why Opportunity Scores Should Be Used Carefully
Market scoring can be useful, but false precision is dangerous.
A model that says:
Bengaluru = 92/100
Mumbai = 89/100
Pune = 84/100
appears scientific but may conceal subjective assumptions about weighting.
A more credible research approach is to show why a market scores well:
Large customer base
• strong industry fit
• deep ecosystem
• high accessibility
• positive growth signals
This makes the analysis transparent and allows individual businesses to apply their own priorities.
Key Takeaways
01 – B2B opportunity should be evaluated across multiple dimensions, not business count alone.
02 – Four broad opportunity types emerge: scale markets, industry clusters, growth markets and niche high-fit markets.
03 – Geography and industry should be analyzed together. The intersection often reveals more than either dimension independently.
04 – Emerging Tier-2 and Tier-3 industrial markets deserve attention alongside major metros. India’s Economic Survey identifies expanding manufacturing activity and infrastructure as important drivers of this shift.
05 – Company stage and business signals can change the attractiveness of an otherwise similar market.
06 – Opportunity should be evaluated alongside competition and execution capability.
07 – The final objective is not a high market score; it is a defensible list of high-fit priority accounts.
Chapter 8 (From Market Intelligence to B2B Lead Generation)
Introduction
Identifying an attractive market is only the midpoint of the B2B growth process.
A company may know that Maharashtra has a large business ecosystem, that Bengaluru has a strong technology cluster, or that manufacturing represents a substantial B2B opportunity. None of these findings, by themselves, produces a sales pipeline.
The commercial challenge is to convert market-level intelligence into account-level action.
That requires a sequence:
Market Intelligence → Segmentation → Account Selection → Decision-Maker Identification → Outreach → Qualification → Conversion
This distinction is increasingly important as B2B buying becomes more complex. McKinsey’s 2024 B2B Pulse research, based on nearly 4,000 decision-makers across 13 countries, found that buyers use an average of 10 interaction channels during their purchasing journey and increasingly expect suppliers to provide a seamless combination of in-person, remote and digital interactions.
The implication is straightforward:
Lead generation should begin with market selection, not with a contact list.
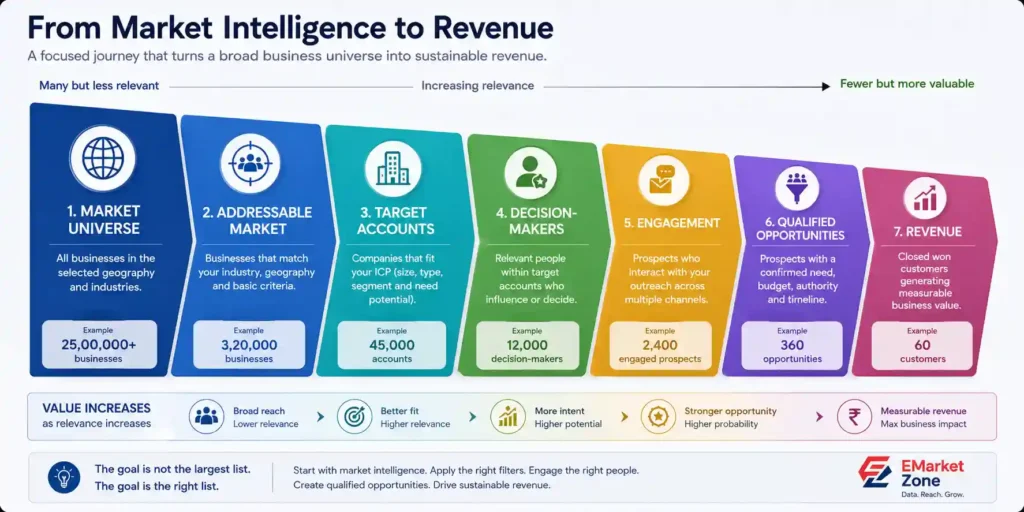
8.1 The Traditional Lead-Generation Problem
Many B2B organizations approach lead generation from the wrong direction.
The process often looks like:
Buy or collect a large database
↓
Send messages
↓
Make calls
↓
Wait for responses
This creates activity, but activity is not the same as commercial progress.
A large prospect universe can contain:
• Irrelevant industries
• Wrong company sizes
• Inactive companies
• Poor-fit locations
• Incorrect decision-makers
• Duplicate records
• Outdated contact information
• Companies with no immediate need
The result is predictable:
More contacts → more outreach → more wasted effort
A better process starts much earlier.
8.2 Market Intelligence Changes the Starting Point
The market-intelligence approach reverses the process.
Instead of asking:
“How many leads can we contact?”
the organization asks:
“Which businesses have the strongest reason to buy?”
The process becomes:
1. Market
Identify attractive geographic and industry markets.
2. Segment
Define the company characteristics that matter.
3. Select
Build a focused universe of relevant companies.
4. Identify
Find the people involved in the purchasing decision.
5. Engage
Use the channel appropriate to the buyer and purchase.
6. Qualify
Determine whether a genuine commercial opportunity exists.
7. Convert
Move qualified accounts into the sales pipeline.
This creates a direct connection between the analysis in Sections 3–8 and actual B2B execution.
8.3 From Market to Account
A practical B2B targeting hierarchy can be represented as:
India
↓
State / Region
↓
City / Business Cluster
↓
Industry
↓
Company Type
↓
Company Scale
↓
Business Stage
↓
Business Need
↓
Priority Account
Each additional layer reduces the size of the potential market while increasing relevance.
This is not a problem.
It is the purpose of segmentation.
A manufacturer selling specialized machinery may begin with millions of businesses nationally but ultimately need only a few thousand companies that satisfy the relevant industrial, geographic, operational and scale criteria.
8.4 Account Selection Should Precede Contact Selection
One of the most important distinctions in B2B lead generation is between selecting accounts and selecting contacts.
An account is the company that may purchase the product.
A contact is a person within that organization.
The correct sequence is therefore:
Identify the right company
↓
Understand the company
↓
Identify the relevant function
↓
Identify the decision-maker / influencer
↓
Select the appropriate contact channel
Starting with individual contacts before establishing account relevance can produce large volumes of activity without meaningful account coverage.
For complex B2B purchases, multiple people may influence the decision.
For example:
Business Owner
• Department Head
• Finance
• IT / Procurement
may all play different roles.
The exact structure varies by company size and purchase complexity.
8.5 The Ideal Customer Profile Becomes Operational
An Ideal Customer Profile (ICP) should not remain a marketing document.
It should determine which accounts enter the sales universe.
A practical ICP might specify:
| Attribute | Example |
|---|---|
| Industry | Manufacturing |
| Geography | Maharashtra + Gujarat |
| Company type | Private limited |
| Scale | Small + Medium |
| Business model | B2B manufacturer |
| Growth signal | Capacity expansion |
| Need | Production technology |
| Decision-maker | Operations / Procurement |
| Priority | High |
The resulting criteria can then be applied systematically to the available business universe.
This turns the ICP into an account-selection mechanism.
8.6 Geography Can Improve Sales Efficiency
The geographic analysis in Section 3 has direct implications for lead generation.
A sales organization can divide its market into:
Territory A
Maharashtra
Territory B
Gujarat
Territory C
Tamil Nadu
Territory D
Karnataka
Instead of giving every salesperson an identical national prospect universe, the organization can assign territories according to:
• Business density
• Industry concentration
• Revenue potential
• Existing customers
• Sales capacity
• Logistics
• Competitive conditions
This makes geographic intelligence useful not only for marketing but also for sales resource allocation.
The State-wise MSME Statistics in India 2026 provides a more detailed reference for comparing India’s state-level business concentration.
8.7 Industry Segmentation Changes the Message
Industry selection should influence more than the prospect list.
It should change the commercial proposition itself.
Consider a cybersecurity company.
Manufacturing
The message may focus on:
• Production continuity
• Industrial systems
• Supply-chain security
• Operational resilience
Financial Services
The message may focus on:
• Data protection
• Fraud risk
• Regulatory requirements
• Customer information
SaaS / Technology
The message may focus on:
• Cloud security
• Identity
• Application security
• Customer trust
The product may be identical.
The commercial context is not.
This is why the industry analysis in Section 5 should feed directly into campaign strategy.
The India Business Statistics 2026 page provides a broader national reference for the business sectors and indicators shaping India’s commercial environment.
8.8 Company Size Should Change the Sales Motion
The same product may require different sales approaches for different company segments.
Micro / Small
Likely characteristics:
• Faster decisions
• Fewer stakeholders
• Lower contract values
• Greater price sensitivity
Potential approach:
Self-service + inside sales + concise outreach
Mid-Market
Potential characteristics:
• Multiple stakeholders
• Growing operational complexity
• Greater technology requirements
Potential approach:
Targeted outbound + demonstrations + consultative selling
Enterprise
Potential characteristics:
• Formal procurement
• Multiple decision-makers
• Security and compliance reviews
• Longer sales cycles
Potential approach:
Account-based selling + executive engagement + solution selling
The lesson is simple:
Segmentation should determine the sales process, not merely the mailing list.
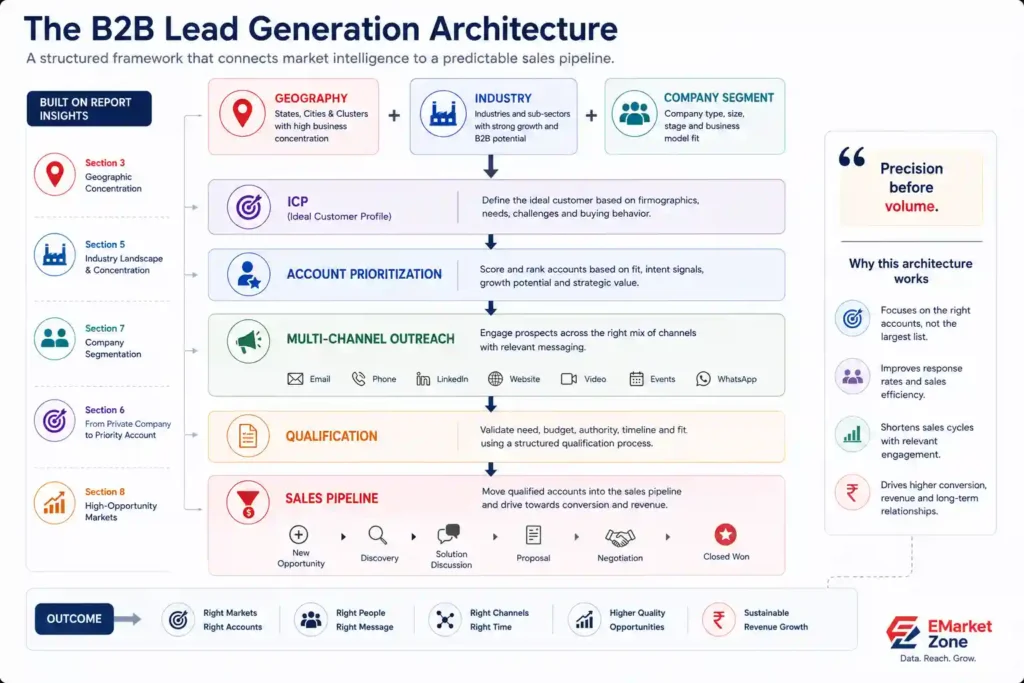
Key Takeaways
01 – Lead generation should begin with market selection, not a contact database.
02 – Account selection should precede decision-maker selection.
03 – Geography, industry, company profile and business signals should work together to define the target universe.
04 – Modern B2B buying is increasingly omnichannel. McKinsey’s 2024 research found buyers using an average of ten interaction channels.
05 – Data quality directly affects sales efficiency. A large database with poor relevance can produce less commercial value than a smaller, highly targeted universe.
06 – Commercial communication must account for India’s applicable telecom and data-protection requirements.
07 – The ultimate metric is not the number of contacts reached; it is the quality and economic value of qualified opportunities created.
Chapter 9 (Data, Intelligence and the Future of B2B Market Development)
Introduction
The ability to identify businesses is no longer the primary challenge in India’s B2B market.
The harder problem is determining which businesses matter, how relevant they are, when they should be approached, and whether the underlying information can be trusted.
India’s formal business ecosystem is becoming increasingly large and structured. The Ministry of MSME dashboard reported 9.28 crore registrations across Udyam and the Udyam Assist Platform as of 15 August 2026, including 5.22 crore Udyam registrations and 4.06 crore Udyam Assist registrations.
At this scale, simply accumulating more records provides diminishing returns.
The competitive advantage increasingly comes from turning business information into usable market intelligence.
9.1 From Business Data to Market Intelligence
There is an important difference between three concepts:
Business Data
Basic information about an organization:
• Company name
• Location
• Industry
• Registration details
• Contact information
Business Intelligence
Structured interpretation of that information:
• Industry concentration
• Geographic concentration
• Company segmentation
• Market size
• Growth patterns
• Competitive environment
Market Intelligence
The final commercial layer:
What should the business do with the information?
This can include:
• Which markets to enter
• Which companies to target
• Which segments to prioritize
• Which accounts deserve sales resources
• Which markets are expanding
• Which opportunities should be monitored
The progression is therefore:
Data → Information → Intelligence → Decision → Action
A database becomes strategically valuable only when it contributes to the final stages.
9.2 The Scale of India's Business Universe Changes the Problem
The latest MSME dashboard data illustrates the magnitude of the underlying business universe.
As of 15 August 2026:
- 5.22 crore enterprises were registered through Udyam.
- 4.06 crore informal micro enterprises were represented through the Udyam Assist Platform.
- Total Udyam + UAP registrations reached 9.28 crore.
The activity distribution was also substantial:
- Manufacturing: 1.85 crore
- Services: 3.53 crore
- Trading: 3.91 crore
These figures demonstrate why broad-market targeting becomes increasingly inefficient.
A business cannot realistically treat every registered enterprise as an equally valuable prospect.
The relevant question becomes:
How efficiently can the national business universe be narrowed into a commercially useful target universe?
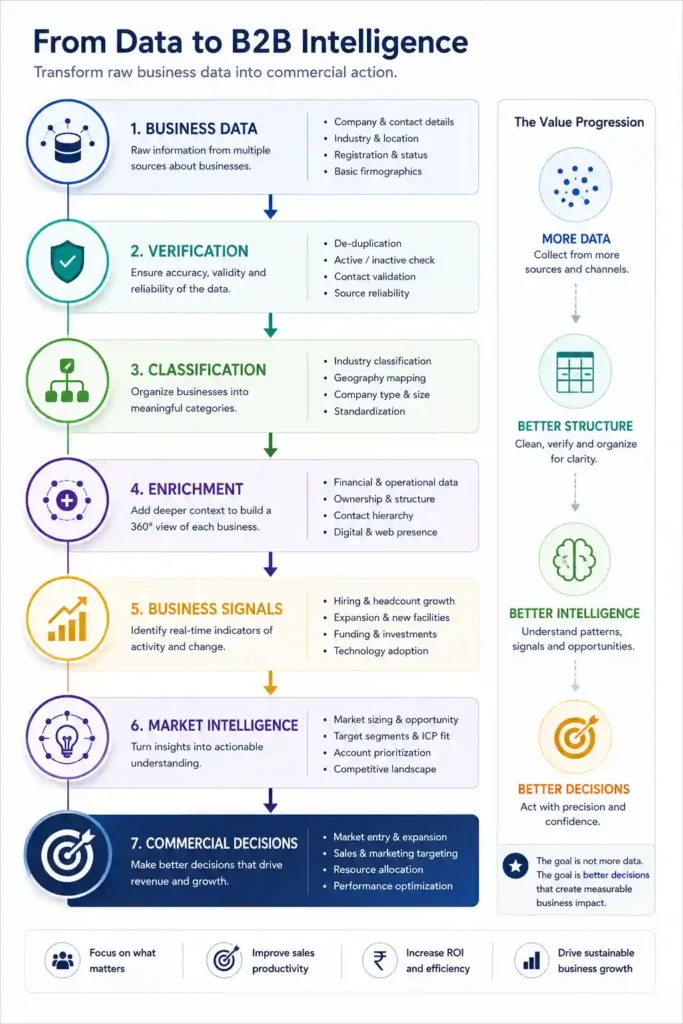
9.3 Data Quality Becomes More Important as Volume Increases
A larger dataset does not automatically create better market intelligence.
In fact, the opposite can occur.
As the number of records increases, problems such as:
• Duplicate businesses
• Outdated information
• Incorrect classification
• Inactive companies
• Missing fields
• Incorrect contacts
• Poor geographic normalization
• Inconsistent industry categories
can become increasingly significant.
This creates a basic B2B data principle:
The value of a dataset depends on the quality of the usable records, not simply the number of records.
For a sales organization, an incorrect record is not merely a data-quality problem.
It can produce:
Wasted outreach → Lower response rates → Lower salesperson productivity → Higher acquisition cost
Data quality therefore becomes a commercial performance variable.
9.4 Segmentation Converts Scale Into Usability
The research in this report has repeatedly demonstrated the same principle.
The national business universe can be progressively narrowed:
India
↓
State
↓
City / Cluster
↓
Industry
↓
Company Type
↓
Company Scale
↓
Business Stage
↓
Need / Intent
↓
Priority Account
Each layer removes businesses that are less relevant to the specific commercial objective.
This is why segmentation can create more value than simply adding records.
A sales team may have access to millions of companies but only need a few thousand accounts that fit its ICP.
9.5 Responsible Use of Business and Contact Data
As B2B intelligence becomes more sophisticated, data governance becomes increasingly important.
India’s Digital Personal Data Protection Rules, 2025 were notified by the Ministry of Electronics and Information Technology on 13 November 2025. The Rules establish the implementation framework for the Digital Personal Data Protection Act, 2023, with different provisions coming into force according to the notified phased timeline.
This matters because business intelligence can contain two fundamentally different categories of information:
Organization-level information
Examples:
• Company name
• Industry
• Registered location
• Corporate structure
Personal information
Examples:
• Individual’s phone number
• Personal email
• Professional identity linked to an individual
• Other information relating to an identifiable person
The compliance considerations can therefore differ depending on what information is collected, how it is processed and how it is used.
B2B market intelligence should consequently be designed around principles such as:
• Purpose limitation
• Data minimization
• Accuracy
• Appropriate security
• Clear governance
• Retention controls
• Responsible outreach practices
The objective is not simply to collect more information.
It is to collect and use appropriate information for a legitimate commercial purpose.
9.6 What This Means for India's B2B Market
India’s business ecosystem is becoming too large and diverse for broad, undifferentiated targeting to remain efficient.
The latest official data demonstrates the scale of the opportunity, while the geographic, industry and company-level analysis in this report demonstrates its complexity.
The opportunity therefore lies not simply in having access to business data.
It lies in being able to answer five questions accurately:
1. Where?
Which states, cities and clusters matter?
2. What?
Which industries and business activities matter?
3. Who?
Which company segments matter?
4. Why now?
Which businesses show relevant commercial signals?
5. What next?
What action should the sales or marketing team take?
When these questions can be answered systematically, business data becomes a genuine decision-support asset.
Final Key Takeaways
01 – India’s business universe is now too large for volume-only B2B targeting. The MSME dashboard recorded 9.28 crore Udyam + UAP registrations as of 15 August 2026.
02 – Data quality, freshness and segmentation are increasingly important.
03 – Enrichment and business signals can transform static company records into more actionable intelligence.
04 – AI can accelerate classification, prioritization and analysis, but it cannot compensate for poor underlying data.
05 – Data governance is becoming a core B2B requirement. India’s DPDP Rules 2025 provide a structured framework for responsible processing of digital personal data.
06 – The strongest B2B intelligence architecture connects market research directly with CRM, sales and marketing execution.
07 – The competitive advantage is shifting from simply having more data to making better decisions from the data.
About This Report
India Business Landscape Report 2026 has been prepared by EMarket Zone to provide a comprehensive overview of India’s evolving business ecosystem. The report combines publicly available government statistics, economic indicators, industry insights, and market analysis to present an integrated view of business trends, regional distribution, industrial development, MSME growth, and future opportunities.
Designed for business leaders, investors, consultants, policymakers, sales professionals, and researchers, this report serves as a practical reference for understanding India’s commercial landscape and supporting informed strategic decision-making.
Looking for verified business contacts or industry-specific business data? Explore EMarket Zone’s database solutions.
End of Report
EMarket Zone
Verified Data. Smarter Growth.
Copyright © 2026 EMarket Zone. All rights reserved.
References
This report is based on publicly available information and industry research, including:
• Ministry of Corporate Affairs (MCA)
• Ministry of MSME
• Department for Promotion of Industry and Internal Trade (DPIIT)
• Reserve Bank of India (RBI)
• Ministry of Commerce & Industry
• National Statistical Office (NSO)
• Economic Survey of India
• Government of India Open Data Platform
• EMarket Zone Research & Analysis (2026)